1,612
Views
4
CrossRef citations to date
0
Altmetric
Research Article

Evaluation of suppliers in the tannery industry based on emergy accounting analysis: implications for resource conservation in emerging economies

ORCID Icon, ORCID Icon & ORCID Icon
Pages 1-14 | Received 22 May 2021, Accepted 13 Sep 2021, Published online: 22 Sep 2021

Figures & data

Figure 1. Locations of the selected companies.

Figure 1. Locations of the selected companies.

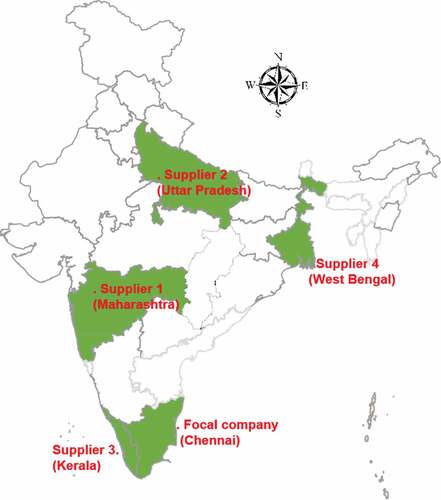
Table 1. Basic characteristic of the suppliers.

Figure 2. Emergy system diagram of a typical supplier.

Figure 2. Emergy system diagram of a typical supplier.

Table 2. Emergy accounting for each supplier. (All data refer to the annual consumption).

Figure 3. Total input resources consumed by each supplier.

Figure 3. Total input resources consumed by each supplier.

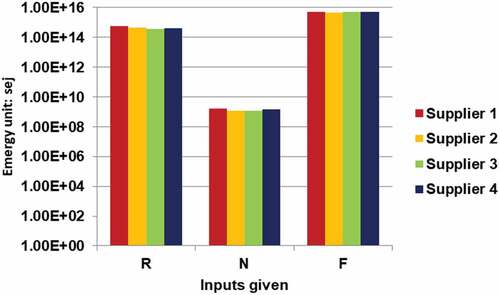
Table 3. Calculated emergy indicators.

Figure 4. Sensitivity analysis of the emergy indicators. (a)Emergy flow when the parameters are increased 20%. (b)Emergy flow when the parameters are decreased 20%.

Figure 4. Sensitivity analysis of the emergy indicators. (a)Emergy flow when the parameters are increased 20%. (b)Emergy flow when the parameters are decreased 20%.

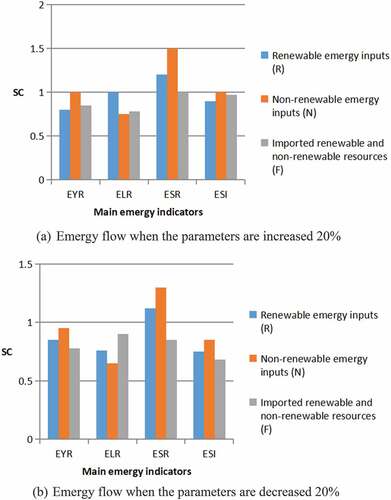
Table A1. Emergy based flows and indicators.