
Figures & data
Figure 1. The main steps of the study.
There are five main steps in the flowchart.
Table 1. Definition of variables.
Table 2. Regional Division of Provinces.
Figure 2. The principle of panel model construction.
The construction and checking process of panel regression model.
Figure 3. Correlation test between variables.
(a) The linear correlation coefficient between lnGDP and lnMotoreVehicles. (b) The linear correlation coefficient between lnGDP and lnParivateCars. (c) The linear correlation coefficient between lnGDP and lnOnlineCars. (d) The linear correlation coefficient between lnGDP and lnTECH. (e) The linear correlation coefficient between lnGDP and lnAQI. (f) The linear correlation coefficient between lnGDP and lnPM2.5. (g) The linear correlation coefficient between lnGDP and lnCoalConsum. (h) The linear correlation coefficient between lnGDP and lnGasConsum. (i) The linear correlation coefficient between lnGDP and lnElectriConsum. (j) The linear correlation coefficient between lnGDP and lnHousePrices.
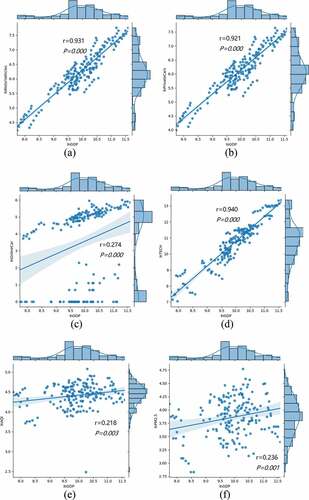
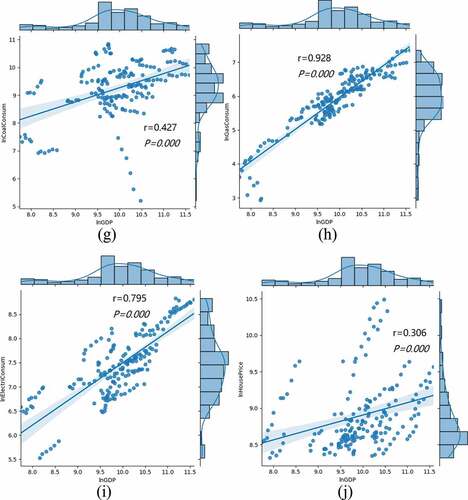
Table 3. Unit root test results of variables.
Table 4. Summary of panel model results in eastern, central and western regions.
Table 5. Model test results.