Figures & data
Figure 1. Quantity of a resource used per unit time as a fraction of time (Hubbert Citation1962).
Figure 2. (a) Ghana System Peak Demand (2017–2020) data from 2021 Power Planning Technical Committee (PPTC) and (b) Ghana Population (2017–2020).
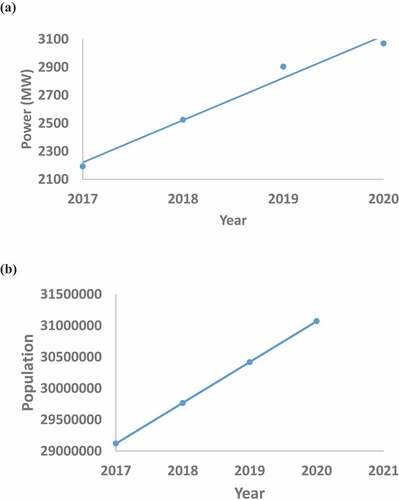
Figure 3. Map of the coastal areas subdivisions of Ghana (blue boundaries) covered by the wave data.
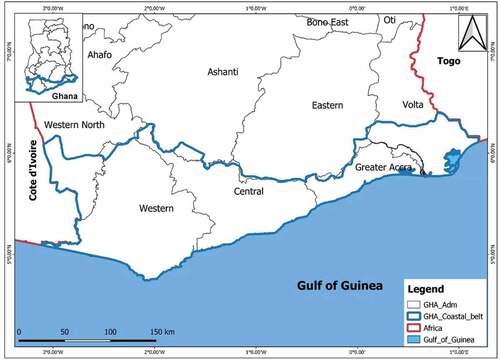
Figure 4. Spatial distribution of the mean of significant wave height in the coast of Ghana between 1979–2020 (a) annual (b) dry season (c) wet season.
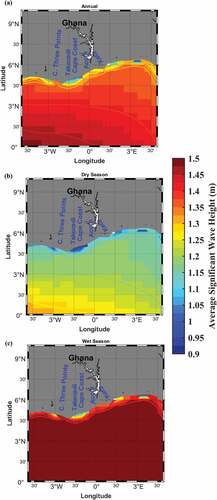
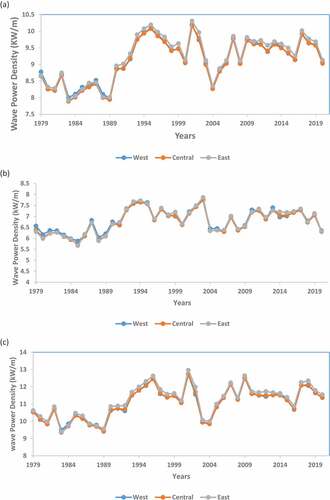
Figure 5. The substantial wave height/m in an average year corresponding to the various coast across Ghana (a) annual (b) dry season (c) wet season.
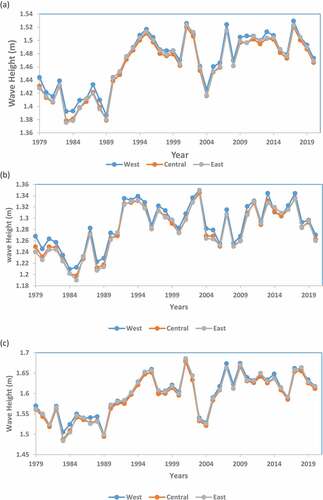
Figure 6. Spatial distribution of the mean wave period in the coast of Ghana between1979-2020 (a) annual (b) dry season (c) wet season.
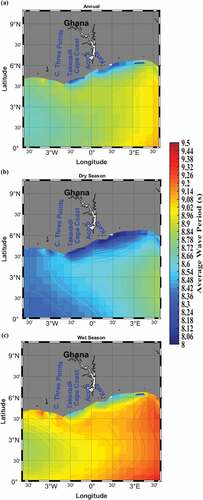
Figure 7. Illustration of mean wave periods (s) in an average year corresponding to the various coast across Ghana (a) annual (b) dry season (c) wet season.
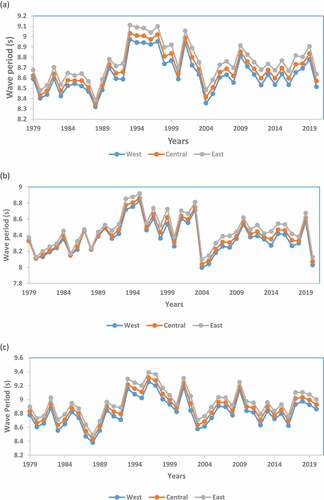
Table 1. Rate of change per year of Significant Wave Height (m) in the three subdivisions of the Ghanaian coast between 1979 and 2020.
Table 2. Rate of change per year of Mean Wave Period(s) in the three subdivisions of the Ghanaian coast between 1979 and 2020.
Figure 8. Spatial distribution of the annual wave power on the coast of Ghana estimated as an average between 1979–2020 (a) annual (b) dry season (c) wet season.
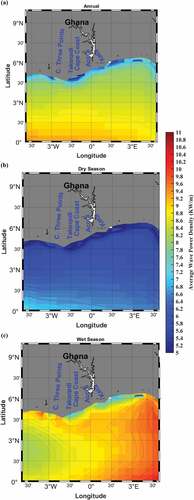
Table 3. Rate of change per year of Wave Power Density (kW/m) in the three subdivisions of the Ghanaian coast between 1979 and 2020.
Figure 9. Illustration of mean wave power (KW/m) in an average year corresponding to the various coast across Ghana (a) annual (b) dry season (c) wet season.