
Figures & data
Figure 1. Geological map of the study area. Three geological features showing the different types of rocks and surficial deposits in the study area.
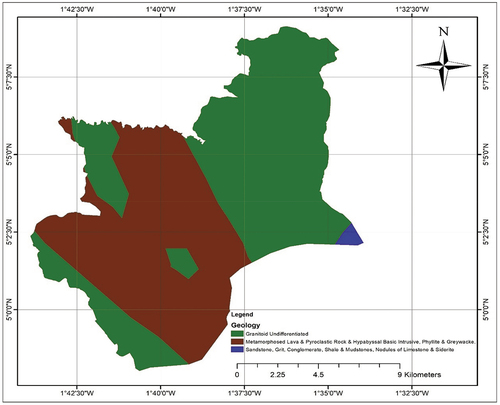
Figure 2. Map showing the sampling locations. A diagram showing the location of Shama Municipality, the waste treatment plant, and three sampling points.
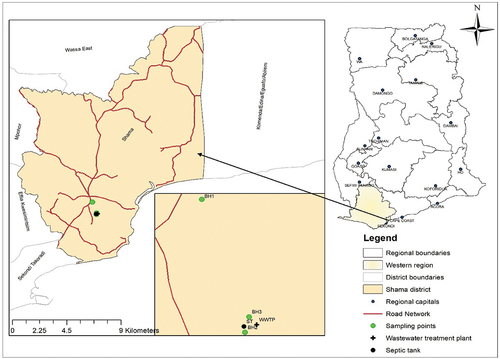
Table 1. Relative weights of groundwater quality parameters.
Table 2. Descriptive statistics of groundwater physicochemical parameters.
Table 3. Analysis of variance (ANOVA) test results.
Table 4. Bacteriological characteristics of groundwater samples.
Table 5. Water Quality Index of groundwater.
Table 6. Classification of water quality based on the WQI (Chung et al. Citation2015).
Table 7. Correlation matrix of water quality parameters.
Table 8. Summary of principal component analysis loading after Varimax rotation.
Data Availability Statement
The author confirms that the data supporting the findings of this study are available within the manuscript