Figures & data
Table 1. Research published in 2022 on plastic waste management based on COVID-19 pandemics.
Figure 1. Schematic drawings of (a) woven, (b) nonwoven, and (c) knitted fabrics (above) and a medical mask made from non-woven PP fabrics (below).
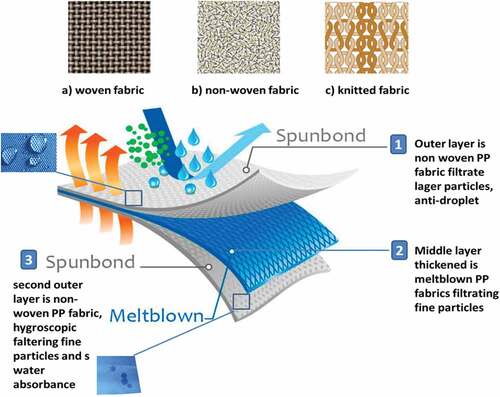
Figure 2. Applying management science methods to solve COVID-19 waste issues and highlighting the important methods for optimizing decision-making.
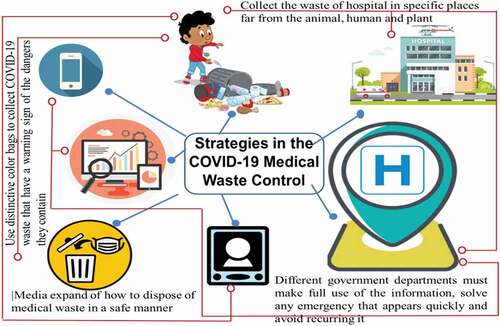
Figure 3. Medical waste management of disinfection and disposal practices.
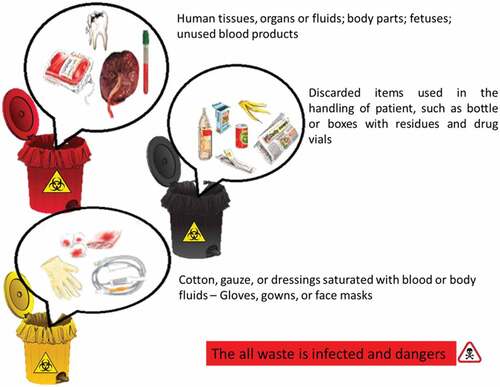
Figure 4. Represents the mechanism of microwaves in which coronaviruses are disinfected by their irradiation and the difference between the microwave and the traditional technique of disinfecting coronavirus waste, such as an autoclave.
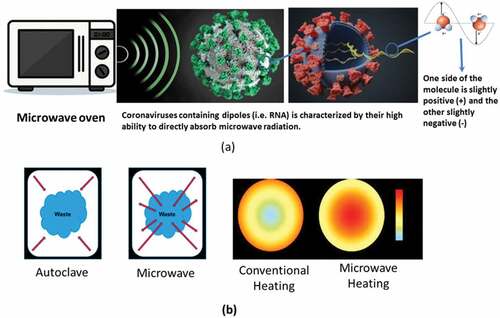
Figure 5. The Eight Advanced and unadvanced categories of medical waste management.
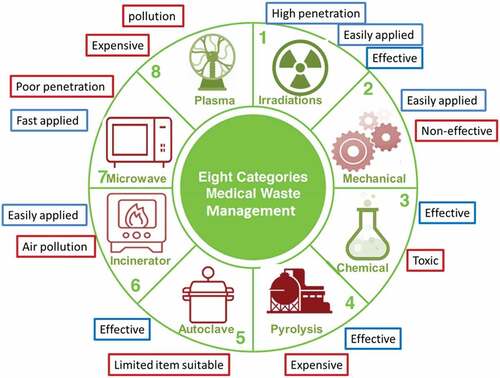
Figure 6. The inverted microscope images of (a) un-irradiated and (b) irradiated face mask samples at dose of 25 kGy.
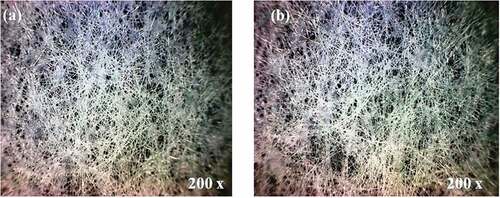
Figure 7. The DSC thermogram of (a) un-irradiated and (b) irradiated face mask samples at dose of 25 kGy.
Figure 8. The FTIR charts of (a) un-irradiated and (b) irradiated face mask samples at dose of 25 kGy.
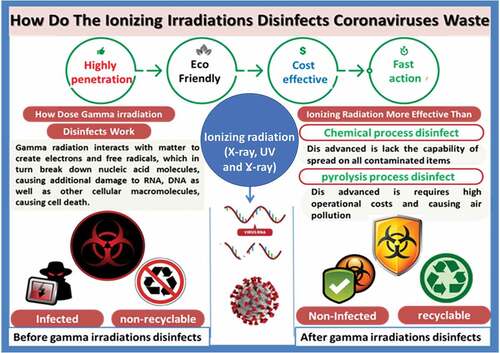
Figure 9. Outlines the gamma irradiation that disinfects coronaviruses waste and how the biohazard materials become more safe and recyclable after exposure to gamma irradiation.