
Figures & data
Figure 1. Four series-connected 120W PV modules (a) without and (b) with BPDs.
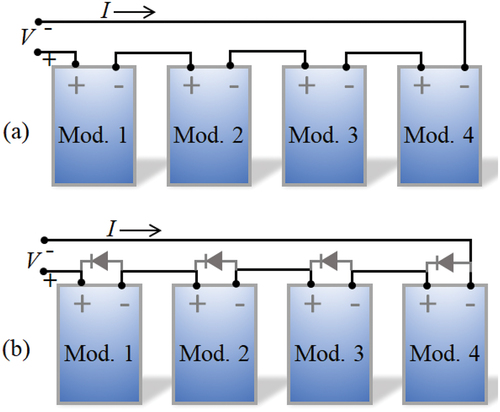
Table 1. Shading percentages with and without BPDs.
Figure 2. Current-voltage (I-V) curves of the PV system of (a) without and (b) with BPDs.
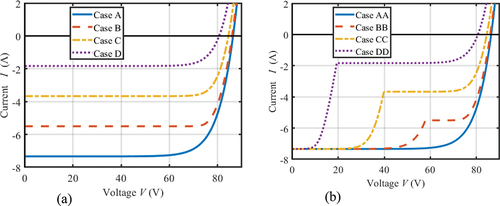
Figure 3. Proposed model of the PV module. The switches are assigned to different names and disconnect or connect the PV submodules based on pulses received by the microcontroller unit (or by a MATLAB code in the simulation). Each submodule comprises nine series-connected cells.
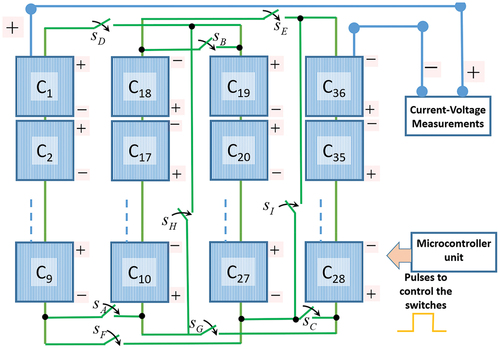
Figure 4. Structure of the proposed system. The actuators in the controlling unit control the mode of the PV submodules’ connection.
Figure 5. (A) Designed and (b) assembled versions of the manufactured printed circuit board for the proposed system.
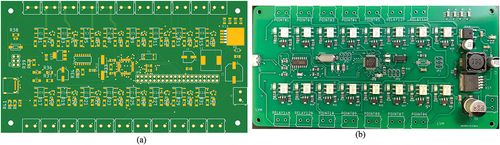
Table 2. Modes of Operation.
Figure 6. Assembled smart PV module as a) illustration and b) real system. The internal connections of the PV submodules are connected to the terminals of the PCB. The switches (transistors) receive pulses from the microcontroller to connect/disconnect the submodules as depicted in . The switches of the same notation are shown multiple of times just for illustration.
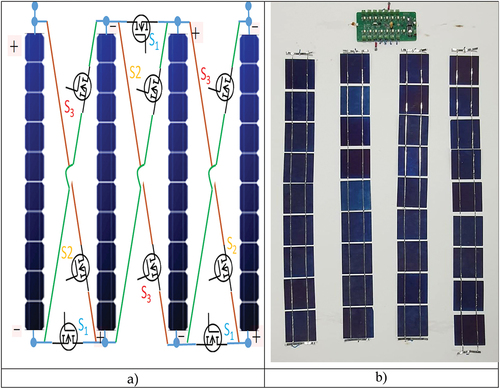
Table 3. Modes of operation and the corresponding switches’ states.
Table 4. PV submodule’s electrical parameters.
Figure 7. Current- and power-voltage characteristics of the conventional PV module without shading.
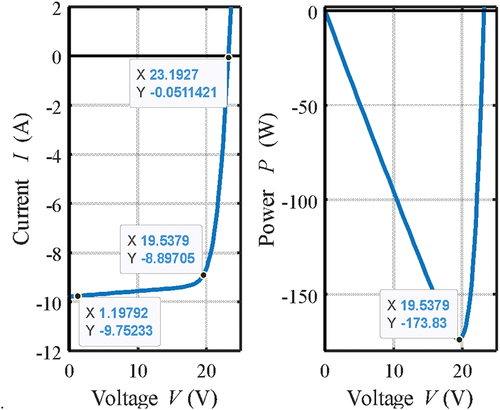
Figure 8. Current- and power-voltage characteristics of the smart PV module (series-connected mode) with fully shading one submodule (the upper two plots) and without shading the submodules (the lower two plots).
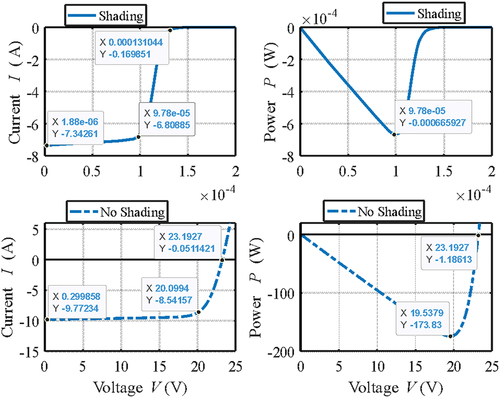
Figure 9. Current- and power-voltage characteristics of the smart PV module (parallel-connected mode) with fully shading one submodule (the upper two plots) and without shading the submodules (the lower two plots).
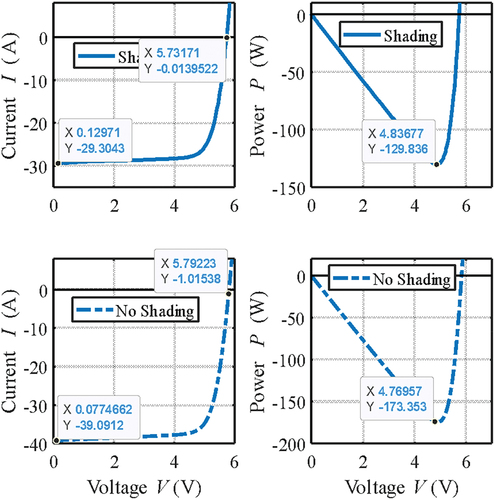
Figure 10. Current- and power-voltage characteristics of the smart PV module (mixed-connected mode) with fully shading one submodule (the upper two plots) and without shading the submodules (the lower two plots).
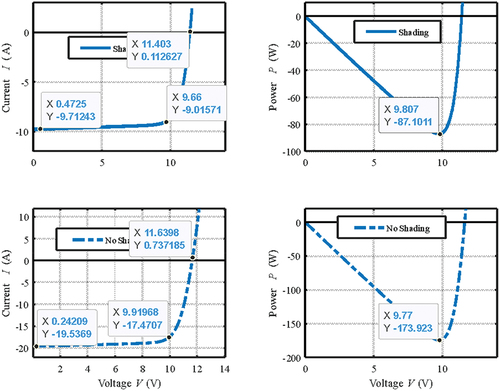
Table 5. Conventional PV module’s parameters with and without shading conditions.
Table 6. Comparison between the parameters of each of the three modes according to different shading conditions.
