
Figures & data
Figure 1. Different feedstocks used in this study (a) Human Excreta (HE), (b) Food Leftovers (FLO), (c) Kitchen Residue (KR) and (d) Cow Dung (CD).
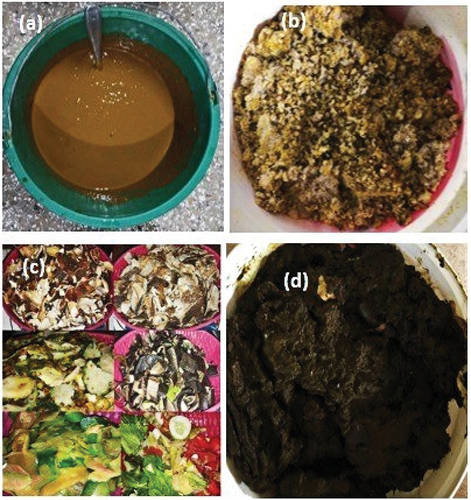
Table 1. Percentage composition of FLO and KR based on wet weight.
Figure 2. Setup and equipment utilized in this study (a)oven, (b) furnace, (c) potentiometric setup for alkalinity, (d) pH meter, (e) COD instruments and (f) ICP-MS.
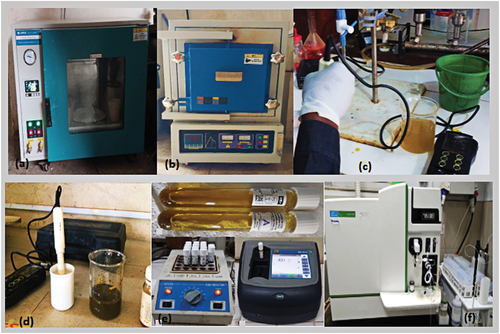
Table 2. Physical, Chemical and Compositional Characteristics of HE, FLO, KR and CD (mean (standard deviation); n = 3).
Figure 3. (a) pH, (b) Alkalinity and (c) COD levels in HE, FLO, KR and CD.
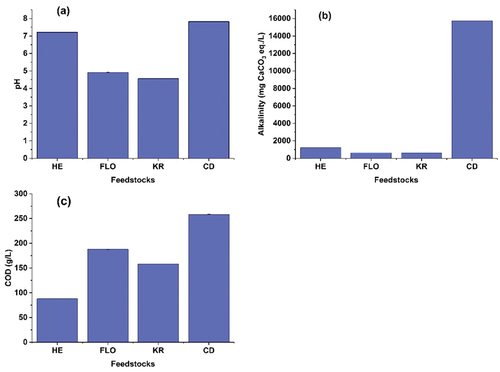
Figure 4. Phosphorus, potassium, calcium, magnesium and sodium content in HE, FLO, KR and CD.
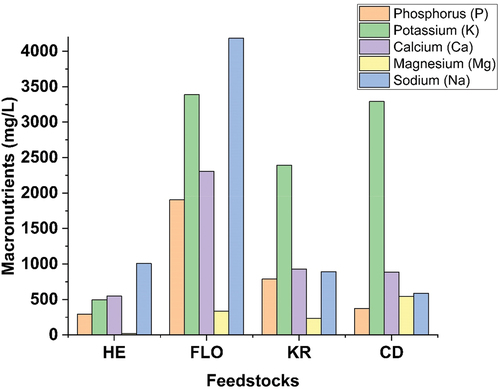
Table 3. Micronutrient Characteristics of HE, FLO, KR and CD (mean (standard deviation); n = 3).
Table 4. Reported stimulatory and inhibitory concentrations of metals on anaerobic biomass (expanded from Romero-Güiza et al. (Citation2016)) compared with values from this study.
Table 5. Theoretical Biogas and Bio-Methane Potential of HE, FLO, KR, and CD.
Data availability statement
Data are available within the article or its supplementary materials.