
Figures & data
Figure 1. Brick-makers in the clay deposit behind Chembe (Authors).
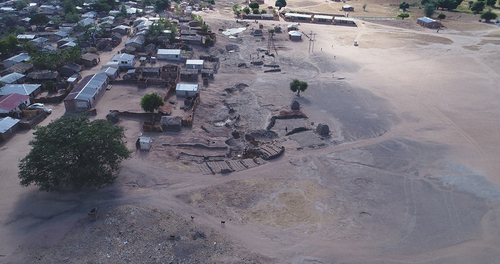
Figure 2. Freshly pressed blocks in Chembe (Authors).
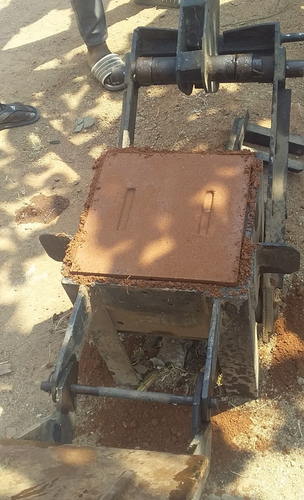
Table 1. Material ratios of brick mix batches.
Table 2. Summary of Chembe soil characteristics.
Table 3. Maximum dry density (MDD) and optimum moisture content (OMC) of soil sample with varying cement ratios.
Figure 3. Particle size distribution of soil sample from Chembe Cape Maclear.
Figure 4. Proctor test results for soil samples mixed with various cement ratios.
Figure 5. Average dry compressive strengths of stabilised soil blocks at varying cement ratios, with error bars of the standard deviation of five samples.
Figure 6. Average flexural strengths of stabilised soil blocks at varying cement ratios, with error bars of the standard deviation of five samples.
Figure 7. Average water absorption of stabilised soil blocks at varying cement ratios, with error bars of the standard deviation of five samples.
Table 4. Cement savings and associated cost savings based on building application.
Table 5. Brick mix design based on building application.