
Figures & data
Figure 1. Variation of ELD and temperature average: (a) the whole observed period, (b) January 2018.
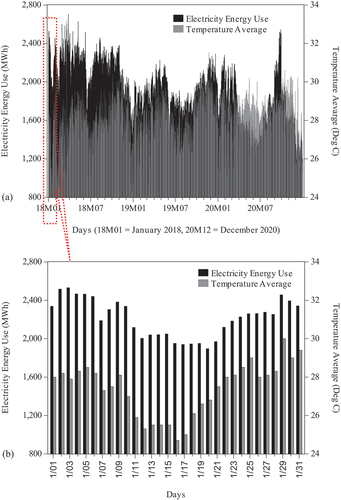
Figure 2. ELD and solar radiation duration: a) the whole observed period, (b) January 2018.
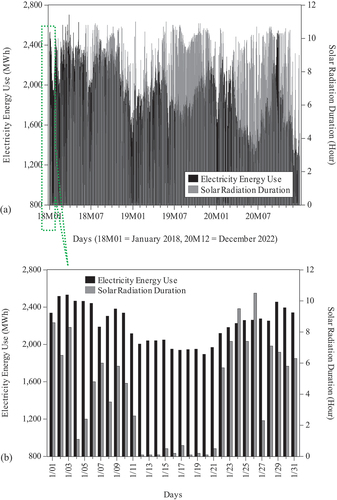
Figure 3. Work flow for ELD analysis.
Figure 4. Phase difference circle.
Figure 5. Return series form for each data variable.
Figure 6. CWT spectrum of the ELD.
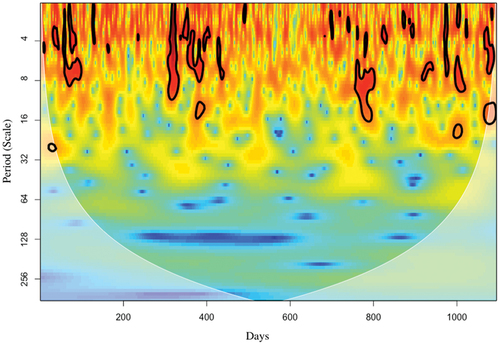
Figure 7. CWT spectrum for each weather variable: (a) temperature, (b) solar radiation exposure, (c) humidity, and (d) wind speed.
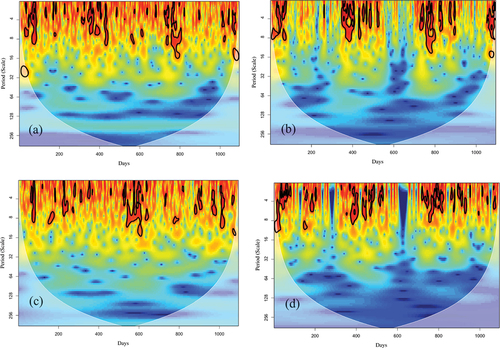
Figure 8. Wavelet coherence between ELD and temperature.
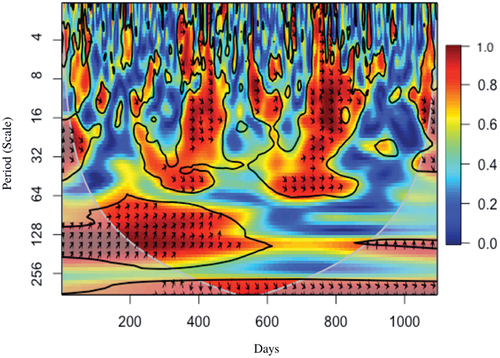
Figure 9. Wavelet coherence between ELD and solar radiation.
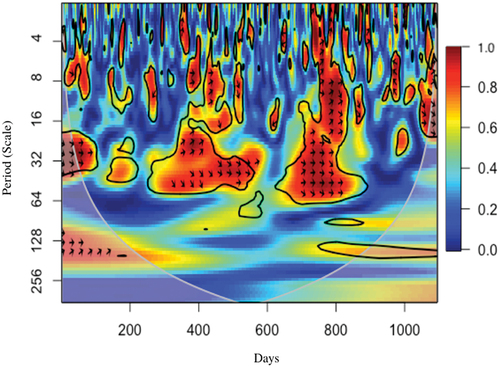
Figure 10. Wavelet coherence between ELD and humidity.
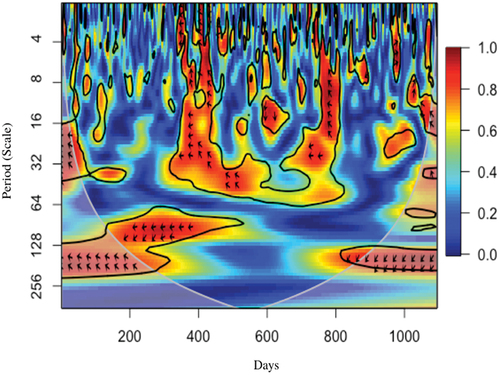
Figure 11. Wavelet coherence between ELD and wind speed.
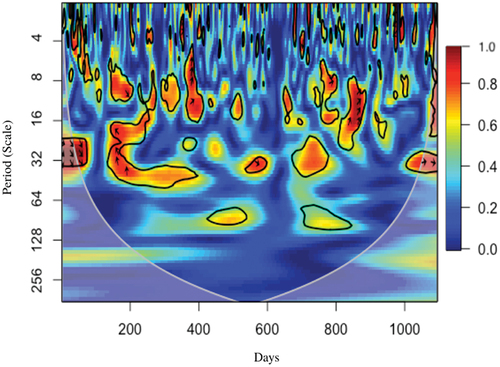
Table 1. Regression results for the whole period.
Table 2. Regression results for the rainy season.
Table 3. Regression results for the dry season.
Table 4. Typical weather parameters in the rainy season.
Table 5. Typical weather parameters in the dry season.
Figure 12. Histogram of daily temperature values: (a) rainy season, (b) dry season.
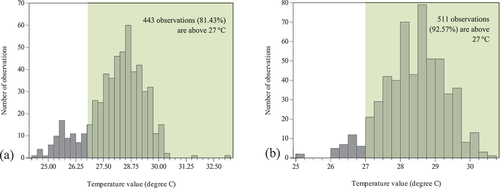
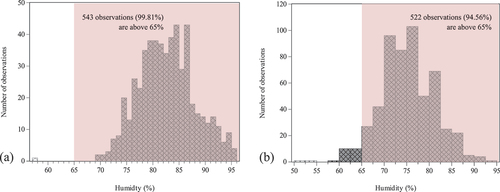
Figure 13. Histogram of daily humidity values: (a) rainy season, (b) dry season.
Data availability statement
Supporting data for this research are provided upon request to corresponding author.
