
Figures & data
Figure 1. Main methodology diagram.
Table 1. Organisation information.
Table 2. Questionnaire and data gathering for commuting.
Table 3. Questionnaire and data gathering of water usage.
Table 4. Questionnaire and data gathering of energy usage.
Table 5. Questionnaire and data gathering of refrigerants.
Table 6. Commuting carbon footprint calculations.
Table 7. Electric cars’ carbon footprint calculations.
Table 8. Water carbon footprint calculations.
Table 9. Electricity carbon footprint calculations.
Table 10. Refrigerants carbon footprint calculations.
Table 11. Commuting carbon footprint reduction.
Table 12. Water carbon footprint reduction.
Table 13. Electricity carbon footprint reduction.
Table 14. Refrigerants carbon footprint reduction.
Figure 2. The whole framework diagram.
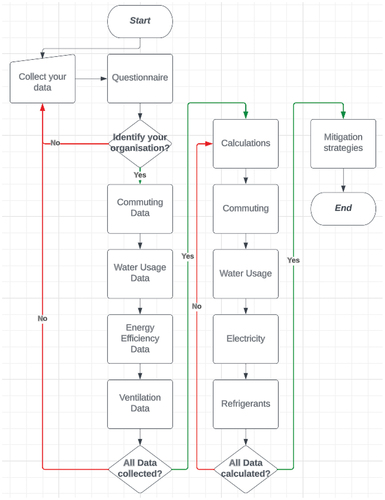
Figure 3. Comparison between our framework and an existing similar framework.
Figure 4. The operational boundary of Nile University.
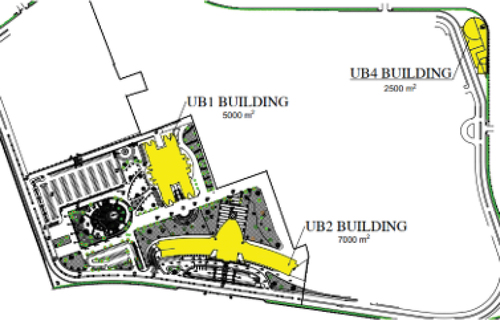
Table 15. Summary of activity data Collected.
Table 16. Breakdown of Scope 1 direct emission sources.
Table 17. Breakdown of Scope 2 indirect emission sources.
Table 18. Data gaps and recommendations.
Table 19. GHG emission intensity of NU.
Table 20. Benchmarking of NU GHG emissions against selected institutions of higher education.
Data availability statement
Data available on request.