
Figures & data
Table 1. Literature review.
Figure 1. Proposed framework for sustainable manufacturing performance.
Table 2. Indicator Formulas.
Table 3. Manufacturing Sustainability Index formula.
Table 4. Results of recapitulation of each indicator.
Table 5. Pairwise comparison of TBL dimensions.
Table 6. Pairwise comparison of economic dimension indicators.
Table 7. Pairwise comparison of environmental dimension indicators.
Table 8. Pairwise comparison of social dimension indicators.
Table 9. Indicator weight of each dimension.
Table 10. Indicator weight of each workstation.
Figure 2. SVSM for a case study on the tire Industry.
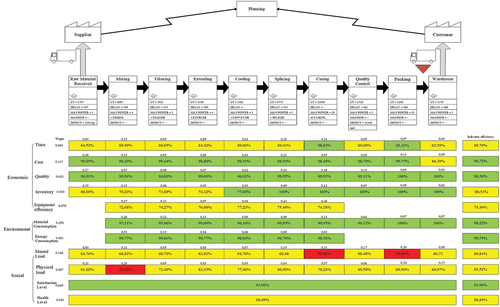
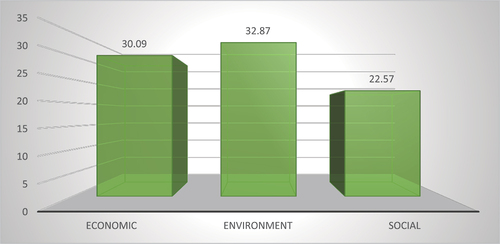
Figure 3. Index performance for each TBL Dimension.
Data availability statement
All data generated or analysed during this study are included in this article.