
Figures & data
Figure 1. A proposed DT-QFD methodological framework.
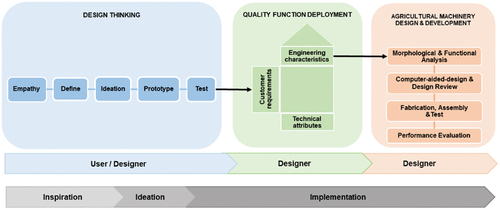
Figure 2. Design Thinking process.
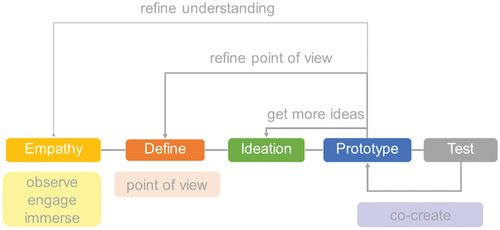
Figure 3. Qualify Function Deployment (QFD) or House of Quality (HoQ) template.
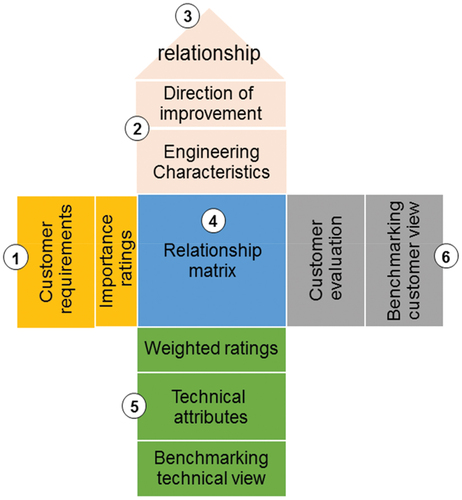
Figure 4. Machine design and development process.
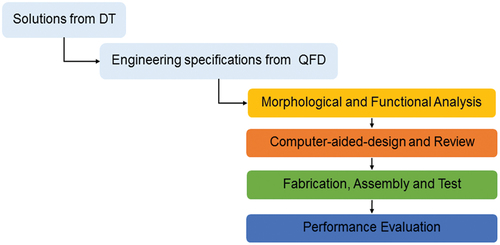
Figure 5. The organic fertiliser making process at the school agricultural learning center.
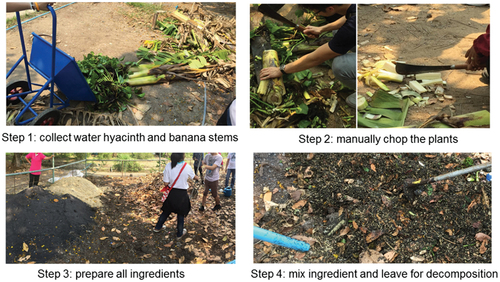
Figure 6. Interviewing and data clustering activities at the learning center.
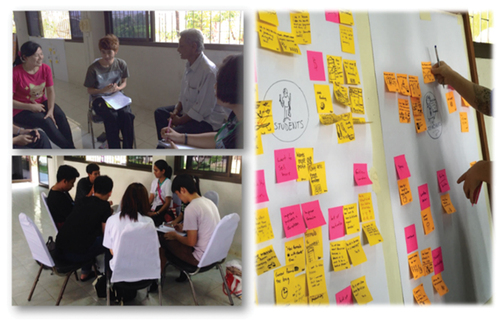
Figure 7. Outcome from the ideation stage.
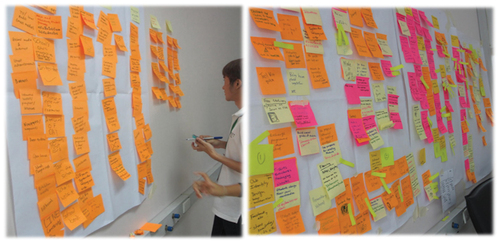
Figure 8. Improved prototypes from the test stage.
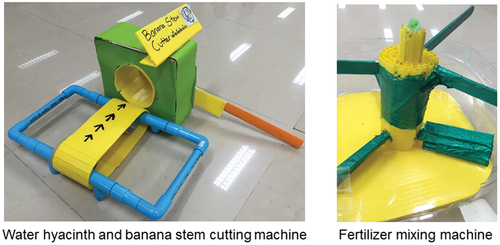
Table 1. Customer requirements and importance ratings.
Table 2. Engineering characteristics and direction of improvement.
Figure 9. Results of the QFD analysis.
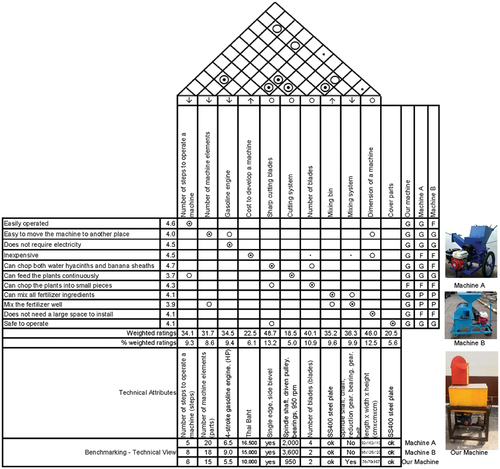
Figure 10. Water hyacinth leafstalks and banana sheaths harvested for morphological analysis.
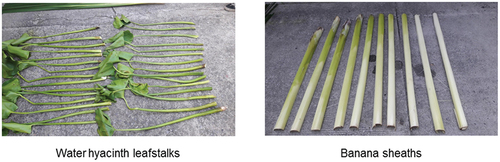
Table 3. Water hyacinth and banana sheath dimension.
Figure 11. Functional tree analysis for winning concepts.
Figure 12. CAD drawings of parts, sub-assemblies and a machine.
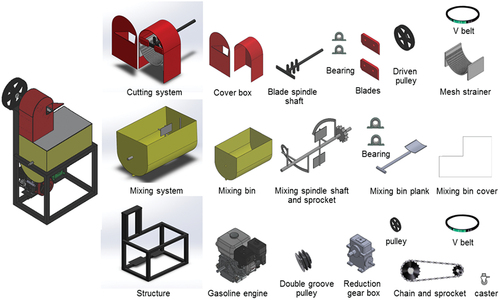
Figure 13. CAD drawing of the multi-function machine and its details.
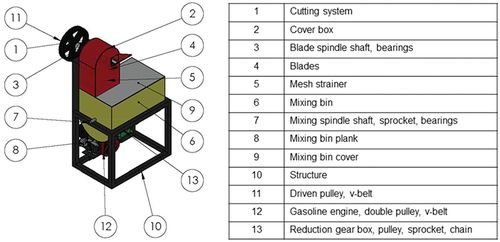
Figure 14. The finished product – a multi-function fertiliser mixing machine.
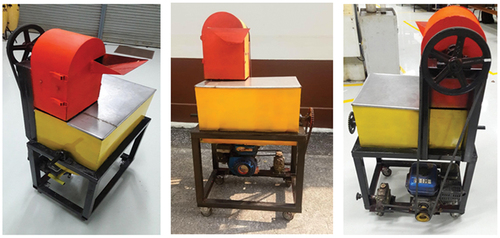
Table 4. Materials list.
Figure 15. Chopped water hyacinth and banana sheath.
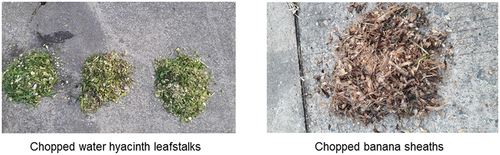
Table 5. The cutting system efficiency.
Table 6. The mixing system performance.
Data availability statement
All data generated or analysed during this study are included in this published article.