
Figures & data
Figure 1. LCA as per ISO 14,040 (Reinout, Huppes, and Guinée Citation2010).
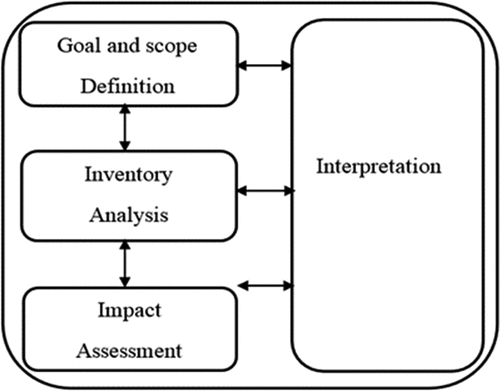
Figure 2. Wall tap mixer 33,420 (similar design manufactured by all the three companies).
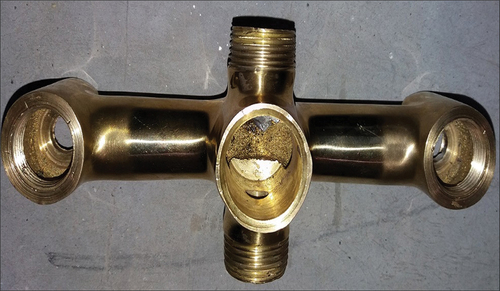
Table 1. Power consumption and CO2 equiv. For manufacturing of component of ‘A’, ‘B’, and ‘C’ bath fitting companies.
Figure 3. System boundary for cradle-to-grave analysis.
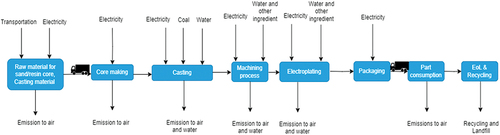
Figure 4. A CO2 equivalent and energy consumption related to company A.
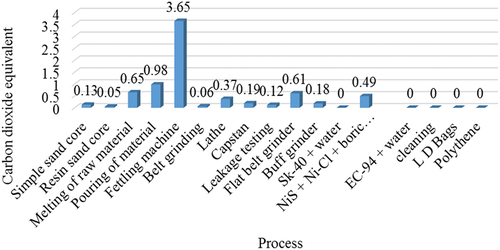
Figure 5. A CO2 equivalent emission and energy consumption related to company B.
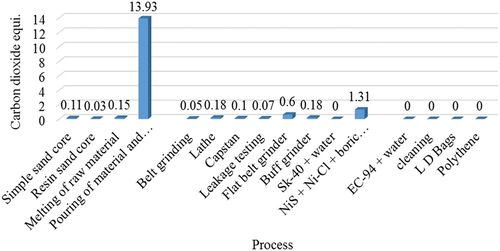
Figure 6. A CO2 equivalent emission and energy consumption related to company C.
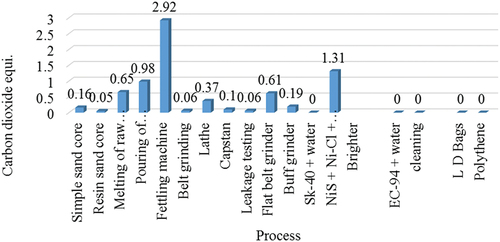
Table 2. GHGs emission for manufacturing of component by ‘A’, ‘B’, and ‘C’ bath fitting companies.
Figure 7. GHGs for manufacturing of component by “A”, “B”, and “C” bath fitting.
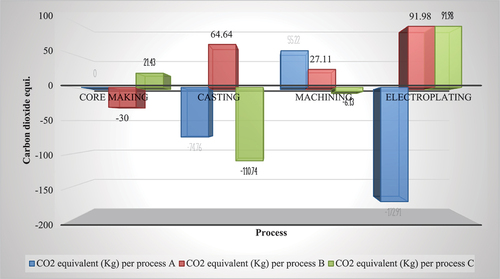
Figure 8. The arrangement of a manufacturing process according to highest probability to reduce CO2 equivalent (hotspot).
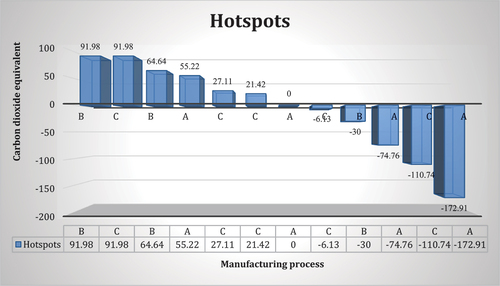
Table 3. Manufacturing processes according to highest probability to reduce CO2 equivalent (hotspot) in descending order.
Data availability statement
The data supporting the findings of this study are available from the corresponding author upon reasonable request.