
Figures & data
Figure 1. Working principle of indirect-direct evaporative cooler.
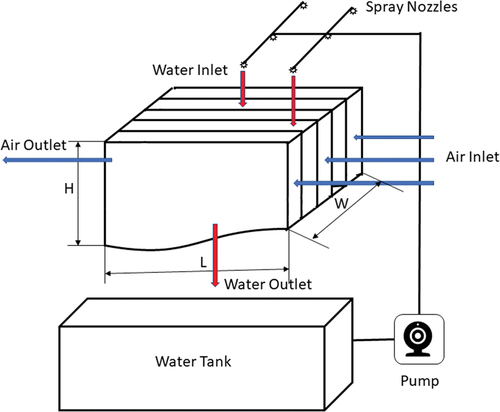
Figure 2. (a) Indirect cooler (b) Celdek Packing (c) Coconut coir packing.
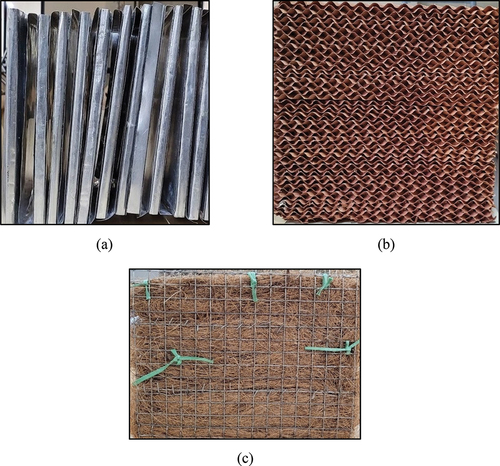
Figure 3. Photo of the experimental setup.
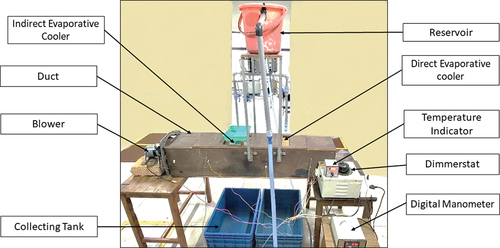
Table 1. Instrument specification; Kumar et al.(Citation2023).
Table 2. Variation of operating conditions.
Table 3. Error values for output variables.
Figure 4. Variation of DBT ratio with the air velocity and water flow rates for different configurations.
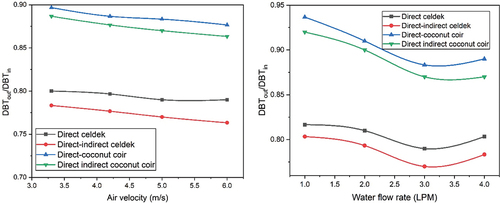
Figure 5. Variation of RH ratio with the air velocity and water flow rates for different configurations.
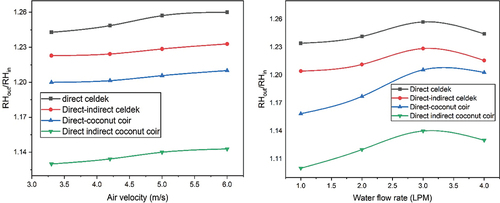
Figure 6. Variation of Wet bulb effectiveness with the air velocity and water flow rates for different configurations.
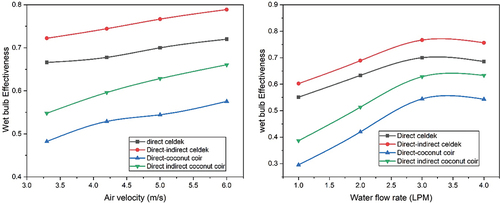
Figure 7. Pressure drop variation with the air velocity and water flow rates for different configurations.
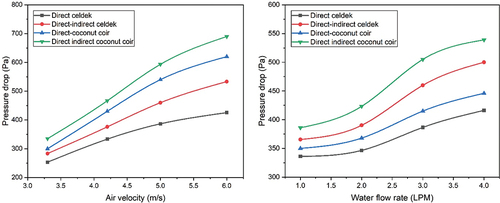
Figure 8. Variation of Energy consumption with the air velocity for different configurations.
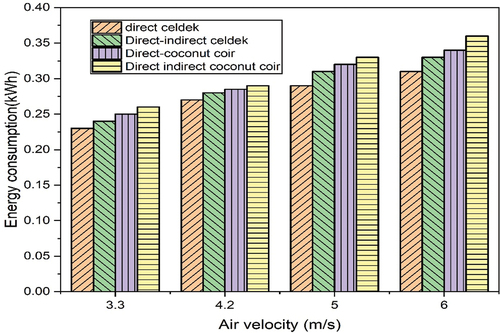
Table 4. Comparison of the present study with the available literature.
Data availability statement
Data will be made available on reasonable request.