
Figures & data
Table 1. Impacts of AV on cities transportation/pros(right) and cons(left) (Maheshwari Citation2018).
Figure 1. Comparison of vehicle operating models of automated driving levels (Williams Citation2021).
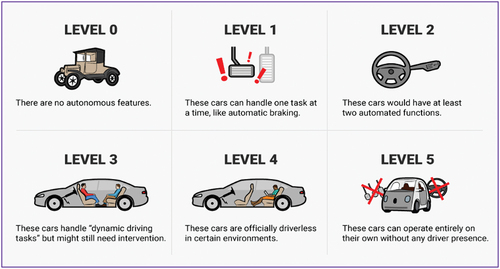
Figure 2. Performance of the automated vehicle from the conventional vehicle perspective in rear-end collisions.
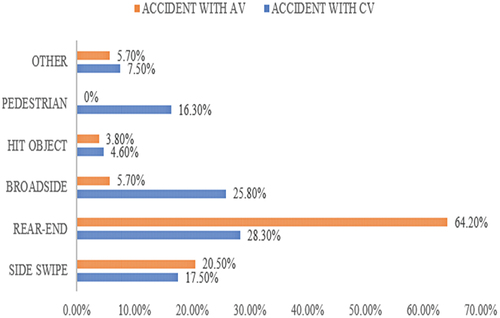
Table 2. AV implementation stage and its impacts (Litman Citation2023).
Table 3. AV implementation predictions set its levels per year.
Figure 3. Input to output process of the AV.
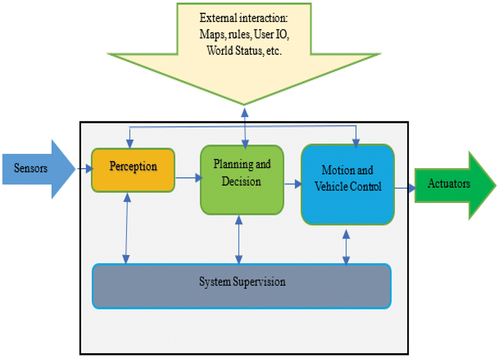
Figure 4. Autonomous vehicle driving all disciplinary research status.
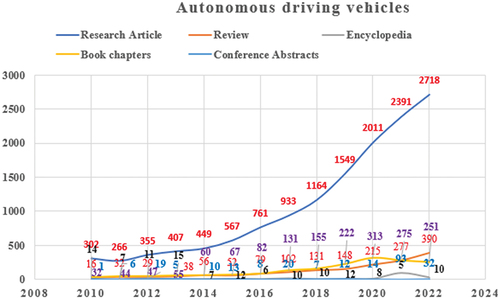
Figure 5. Automated vehicle for all disciplinary research status.
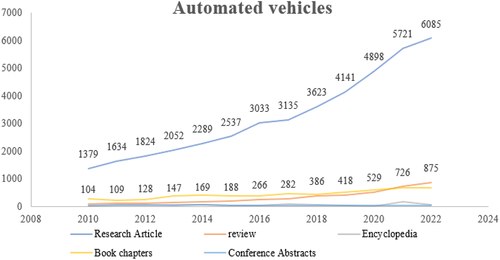
Figure 6. Autonomous vehicle driving engineering (only) discipline research status.
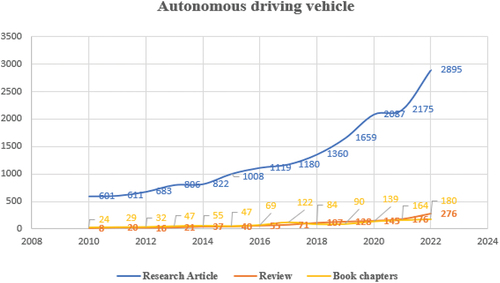
Figure 7. Automated vehicle engineering discipline (only) research status.
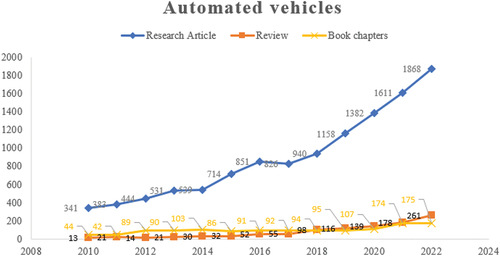
Table 4. Summary of automated vehicle companies and their background.
Table 5. Comparable table based on different automated vehicle machine learning algorithms.
Table 6. Current autonomous vehicle driverless testing permitted companies, algorithms, challenges and gaps, and their vulnerability.
Figure 8. AV functional performance hierarchies.
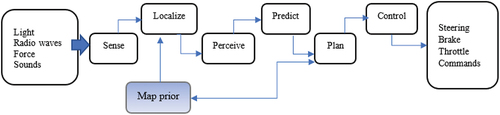
Table 7. (SAE Citation2018) Reliability requirements, functions, and software information.
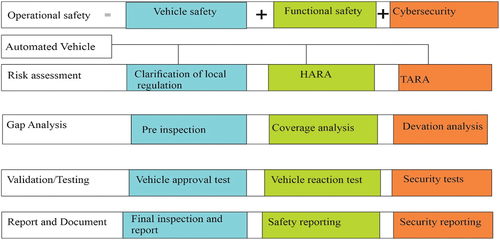
Figure 9. Overall approach for evaluation of AV safety.
Data availability statement
We can encourage that the data we have used in this paper are available on our hands and we can be ready to provide when necessary.