
Figures & data
Table 1. Adapted from World Bank. 2019. Wind resource mapping in Zambia: 24-month site resource report. Washington, DC, USA: World Bank. Renewable energy wind mapping for Zambia (Odoi-Yorke et al. Citation2022.).
Figure 1. Shows wind regime measurements conducted at eight meteorological (met) mast sites across the country.
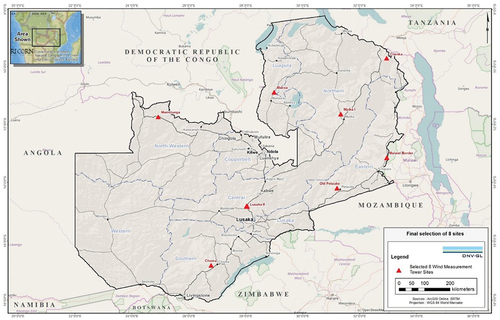
Table 2. Proposed wind turbine model parameters (DNV Report Citation2023).
Table 3. Adapted from World Bank. 2019. Wind resource mapping in Zambia: 24 month site resource report. Washington, DC, USA: World Bank. Renewable energy wind mapping for Zambia.
Table 4. Adapted from World Bank. 2019. Wind resource mapping in Zambia: 24 month site resource report. Washington, DC: World Bank. Renewable energy wind mapping for Zambia.
Figure 2. Methodology flow chart used to evaluate the economic feasibility of the wind farms.
Table 5. Summary of financial assumptions.
Table 6. Adapted from Techno-economic assessment of wind energy potential at three locations in South Korea using long-term measured wind data (Langer et al. Citation2022).
Table 7. Techno-economic parameters for the eight sites using electricity tariff of 0.07 USD/KWh.
Figure 3. Wind turbine economics at 0.07 USD/kWh electricity tariff for Choma site.
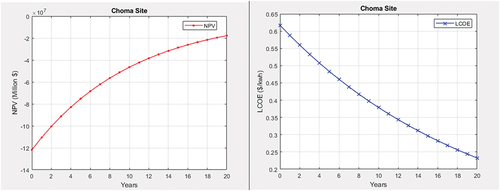
Figure 4. Average electricity tariff (0.07 USD/kWh) and (0.617 USD/kWh) sensitivity analysis for the Choma site.
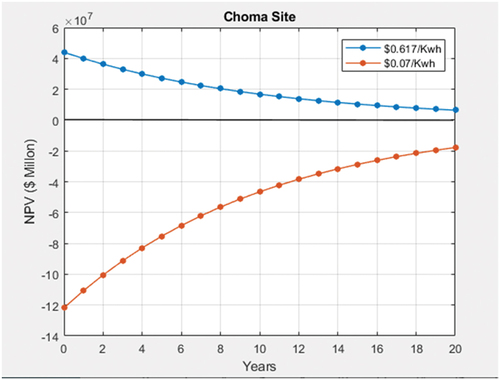
Figure 5. Wind turbine economics at 0.07 USD/kWh electricity tariff for Mwinilunga site.
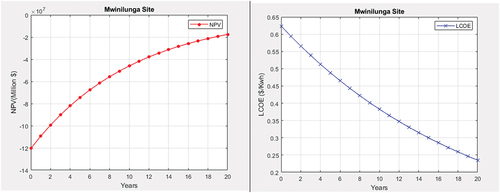
Figure 6. Average electricity tariff (0.07 USD/kWh) and (0.624 USD/kWh) sensitivity analysis for Mwinilunga.
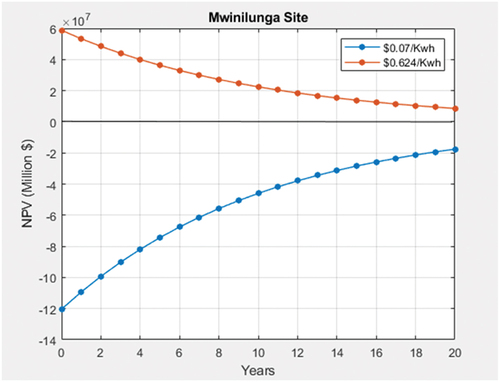
Figure 7. Wind turbine economics at 0.07 USD/kWh electricity tariff for Lusaka site.
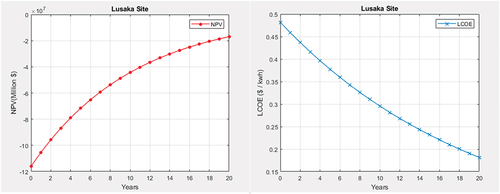
Figure 8. Average electricity tariff (0.07 USD/kWh) and (0.482 USD/kWh) sensitivity analysis for Lusaka.
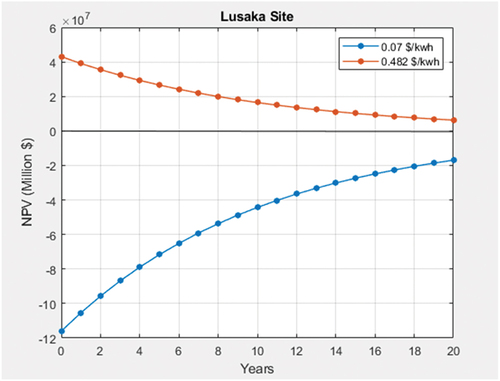
Figure 9. Wind turbine economics at 0.07 USD/kWh electricity tariff for Mpika site.
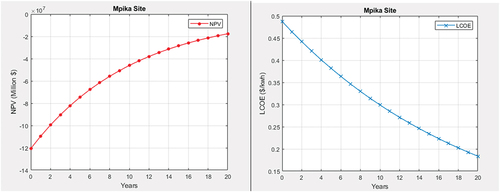
Figure 10. Average electricity tariff (0.07 USD/kWh) and (0.487 USD/kWh) sensitivity analysis for Mpika.
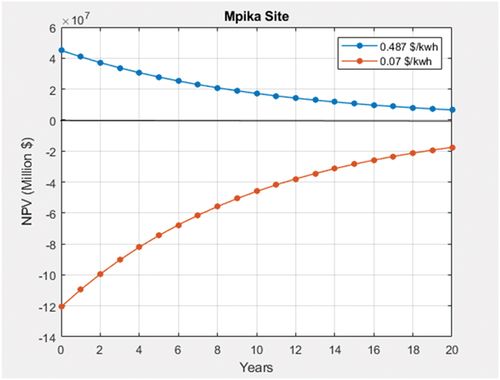
Figure 11. Wind turbine economics at 0.07 USD/kWh electricity tariff for Chanka site.
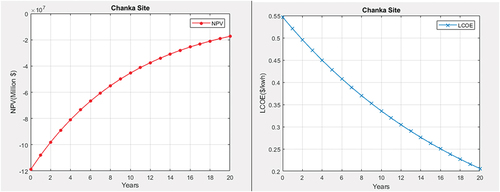
Figure 12. Average electricity tariff (0.07 USD/kWh) and (0.547 USD/kWh) sensitivity analysis for Chanka.
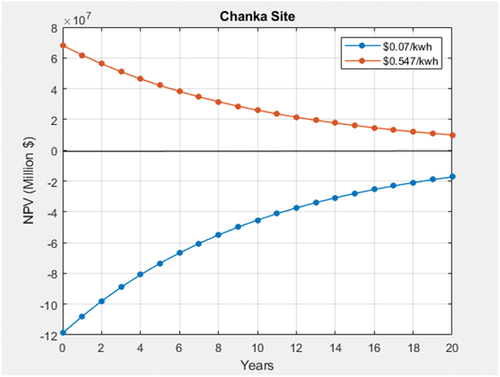
Figure 13. Wind turbine economics at 0.07 USD/kWh electricity tariff for Petauke site.
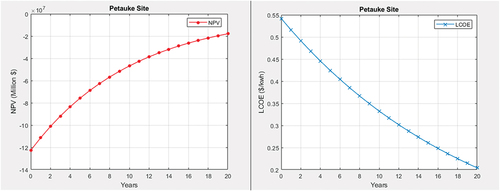
Figure 14. Average electricity tariff (0.07 USD/kWh) and (0.542 USD/kWh) sensitivity analysis for Petauke.
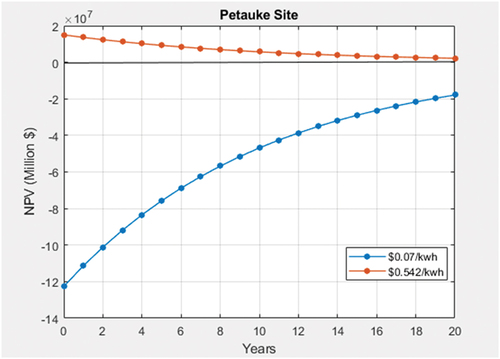
Figure 15. Wind turbine economics at 0.07 USD/kWh electricity tariff for Mansa site.
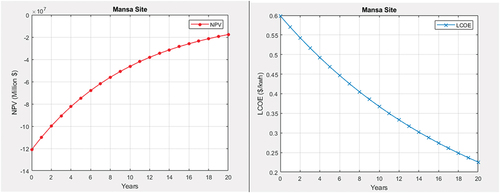
Figure 16. Average electricity tariff (0.07 USD/kWh) and (0.599 USD/kWh) sensitivity analysis for Mansa.
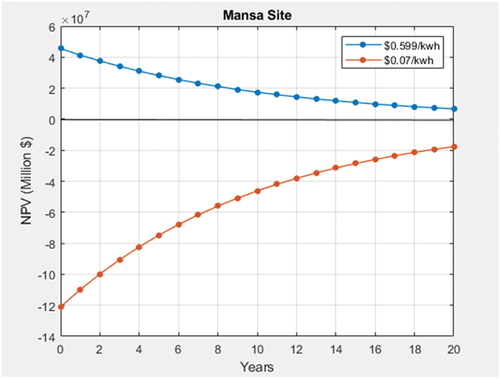
Figure 17. Wind turbine economics at 0.07 USD/kWh electricity tariff for Malawi site.
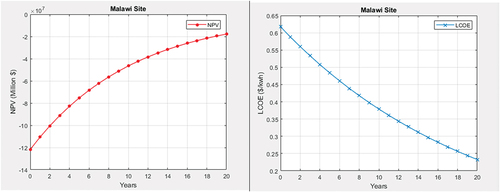
Figure 18. Average electricity tariff (0.07 USD/kWh) and (0.617 USD/kWh) sensitivity analysis for Malawi.
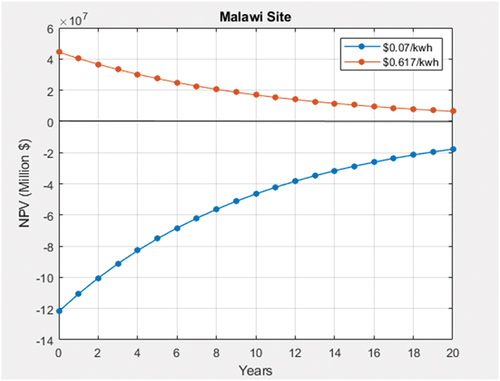
Table 8. Techno-economic parameters using the average electricity tariff of 0.182 USD/kWh.
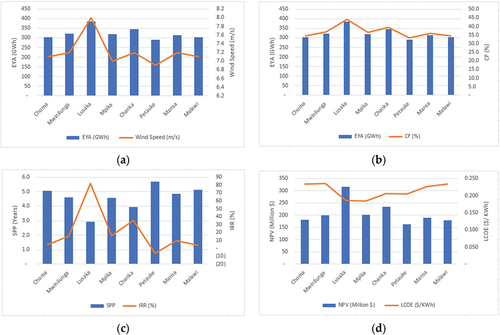
Figure 19. Parameter estimations of the sites: (a) EYA and wind speed; (b) EYA and CF; (c) SPP and IRR; (d) IRR and PBP.
Data availability statement
The data that support the findings of this study are available from the corresponding author, S.M, upon reasonable request.