
Figures & data
Figure 1 Typical VRF system modelled in this study. (Modified from figures presented in SHASE (Citation2010)).
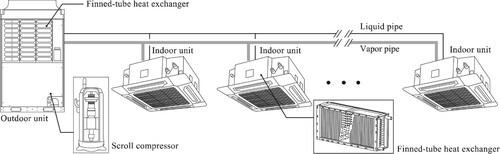
Figure 2 Energy flow of VRF heat pump model.
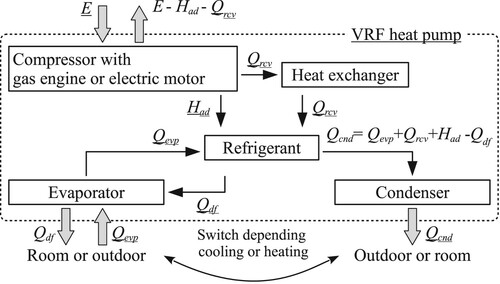
Figure 3 Change in moist air state in the evaporator.
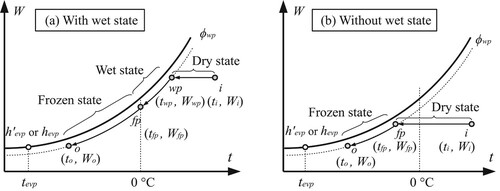
Figure 4 Flowchart of heat-transfer surface (Sevp) calculation.
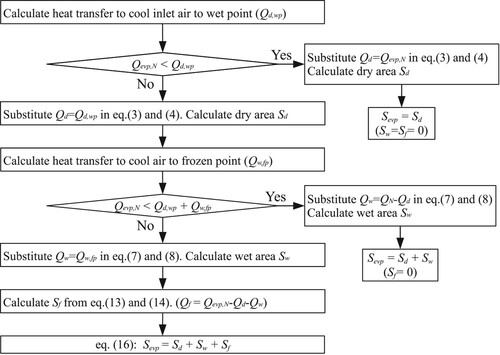
Figure 5 Flowchart of heat transfer (Qevp) calculation.
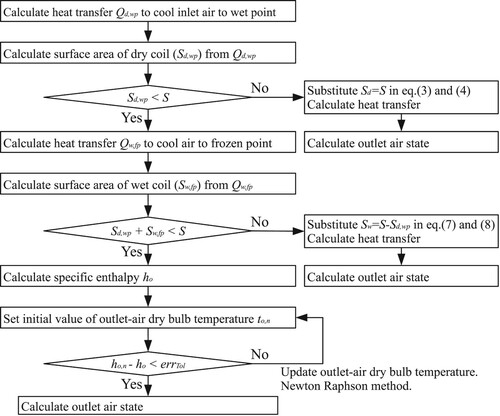
Figure 6 Result of the sensitivity analysis of the evaporator model.
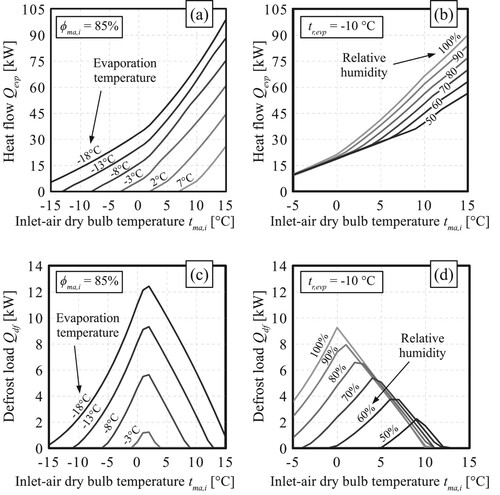
Table 1 Nominal specifications of the evaporator.
Figure 7 Moist air state change at the condenser.
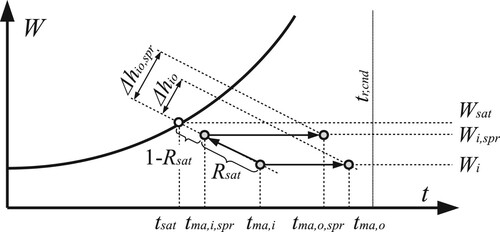
Table 2 Nominal specifications of the condenser.
Figure 8 Result of the sensitivity analysis of the condenser model.
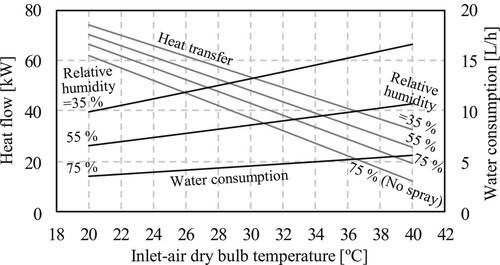
Figure 9 Refrigeration cycle.
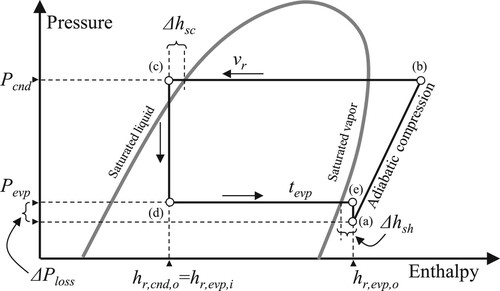
Table 3 Boundary conditions of the VRF heat pump model.
Figure 10 Outline of the calculation procedure of the cooling model.
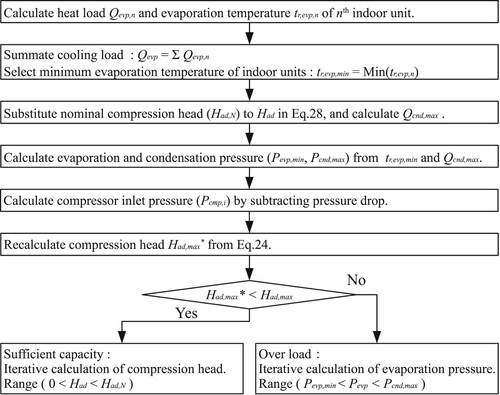
Figure 11 Calculation of the average outlet air state based on the thermo-off time ratio.
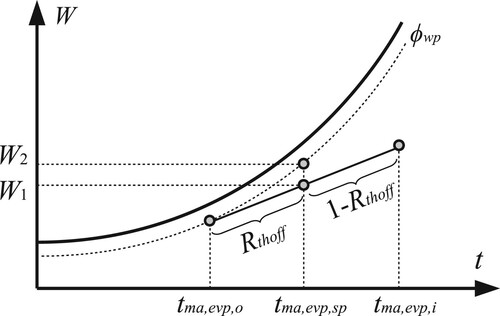
Table 4 Information used to estimate the parameters of the cooling model.
Figure 12 Cooling capacity and nominal outlet-air temperature for 10 different indoor units.
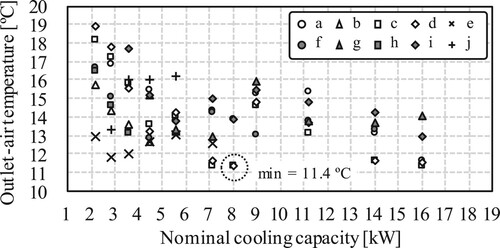
Figure 13 Relationship between Rqma,c, COP, and outlet-air temperature.
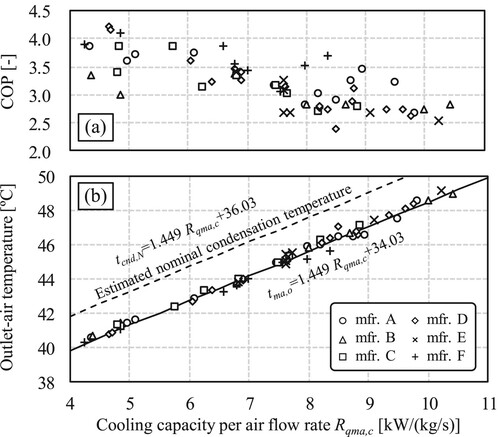
Figure 14 Refrigeration cycle changes with long refrigerant piping.
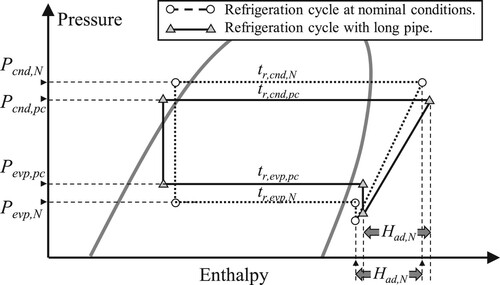
Table 5 Estimated parameters of cooling model.
Figure 15 Estimated performance curve of the compression head-efficiency ratio.
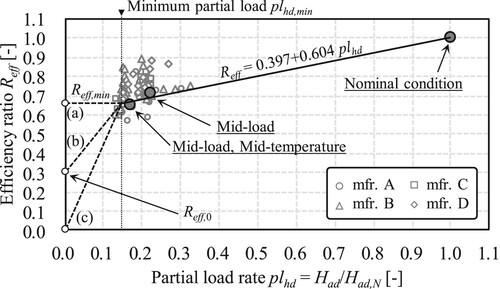
Figure 16 Electricity under partial load operation.
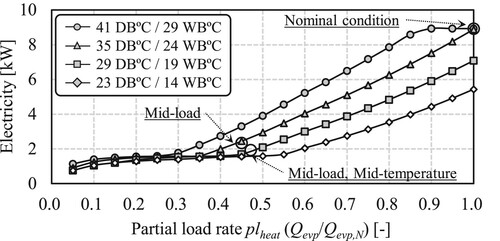
Figure 17 Effect of unbalanced heat load of indoor units on electricity.
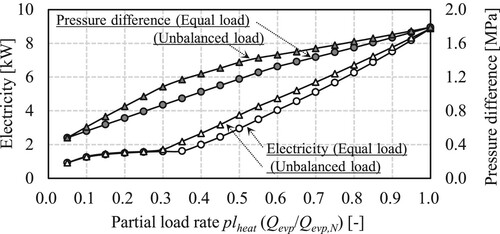
Figure 18 Relationship of pipe length and height difference between indoor and outdoor units and pipe length correction factor.
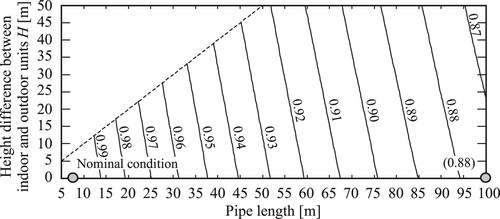
Figure 19 Relationship between the inlet-air conditions of indoor and outdoor units and COP.
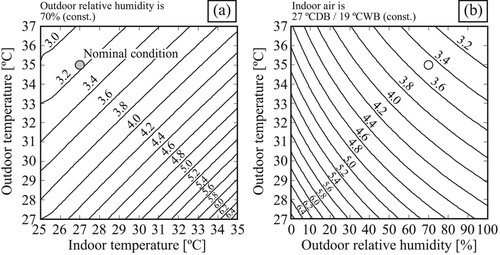
Figure 20 Heat pump cycle.
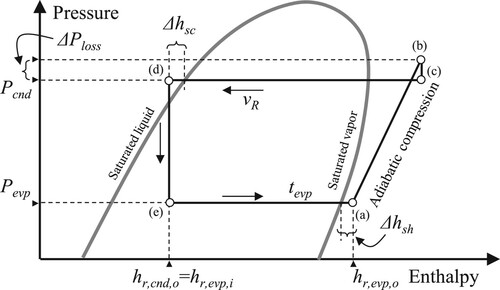
Figure 21 Calculation procedure for heating model.
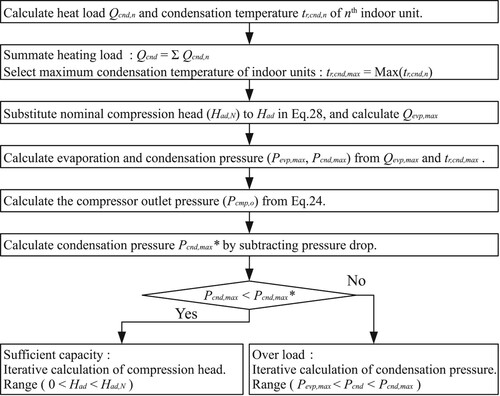
Table 6 Information used to estimate the parameters of the heating model.
Figure 22 Heating capacity and nominal outlet-air temperatures for 10 different indoor units.
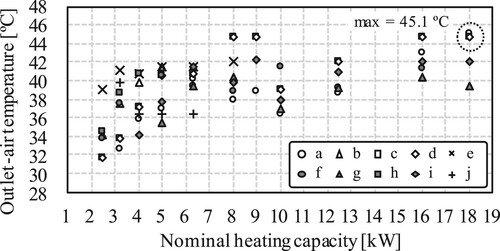
Figure 23 Relationship between Rqma,h, COP, and outlet-air temperature.
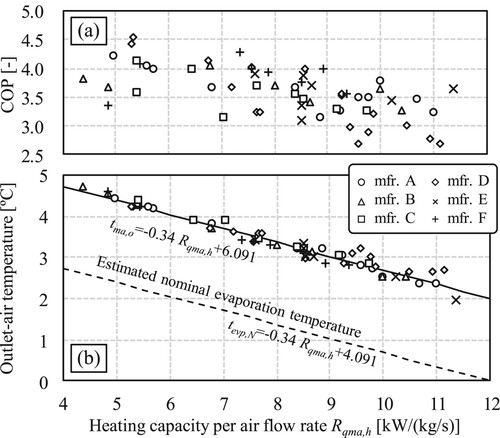
Table 7 Estimated parameters of heating model.
Figure 24 Estimated compression-head efficiency characteristics.
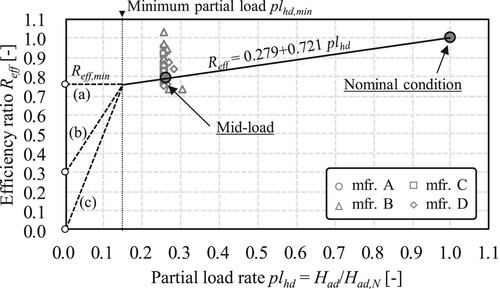
Figure 25 Electricity consumption under partial load operation.
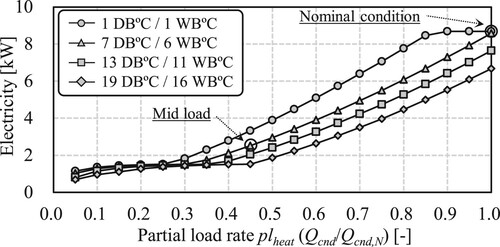
Figure 26 Effect of unbalanced heat load of indoor units on electricity consumption.
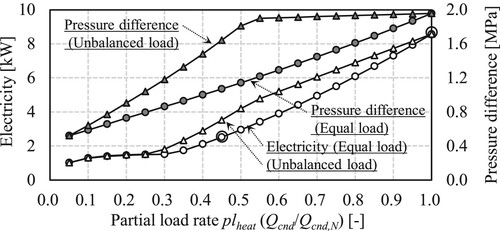
Figure 27 Effect of pipe length and height difference between indoor and outdoor units on pipe-length correction factor.
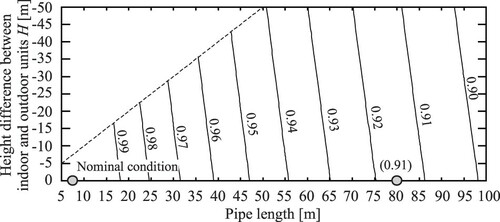
Figure 28 Effects of indoor and outdoor inlet-air state on COP.
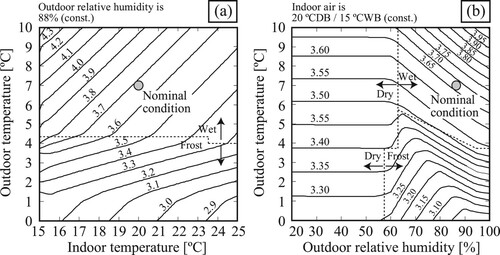
Table 8 Specifications of gas engine heat pump.
Figure 29 Effect of heat recovery, outdoor-air temperature, and heat load on COP ratio.
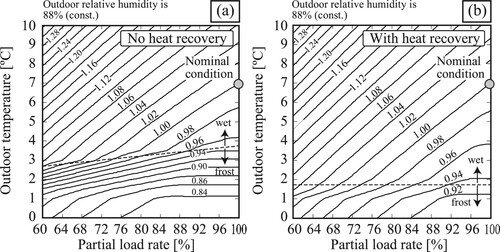
Table 9 Measured indoor unit heat load combinations and electricity (Cooling).
Table 10 Measured indoor unit heat load combinations and electricity (Heating).
Figure 30 Comparison between the actual measured values and the predicted values of electricity by simulation.
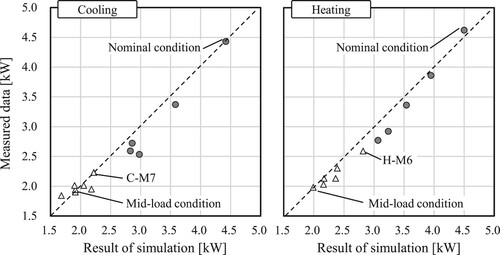
Figure 31 Plan and air conditioning zone.
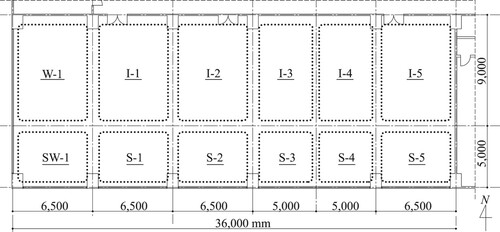
Table 11 Indoor-unit cooling capacities.
Table 12 Indoor-unit specifications.
Table 13 Outdoor-unit specifications.
Figure 32 Monthly heat load, electricity requirement for heating, and COP.
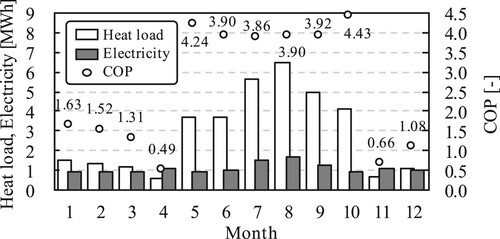
Figure 33 Cumulative frequency for each partial load rate.
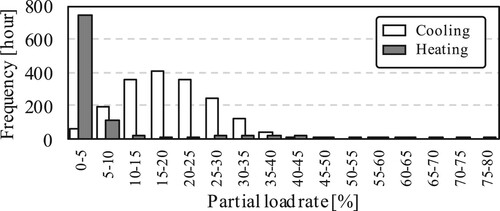
Figure 34 Relationship between the partial load rate and COP.
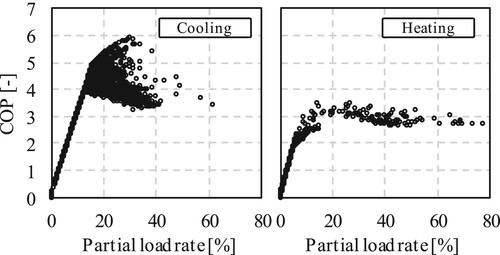
Figure 35 Relationship between compression ratio (RHL) and COP.
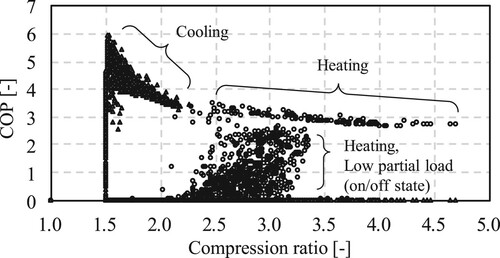
Table 14 Simulation cases.
Table 15 Simulation results.
Figure 36 Change in compression ratio (RHL).
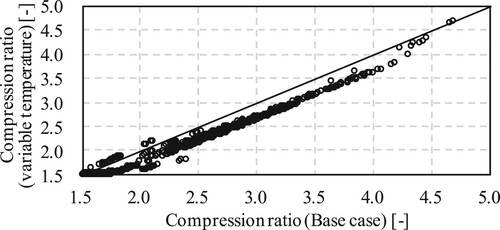
Figure 37 Relationship between outlet-air relative humidity and electricity ratio.
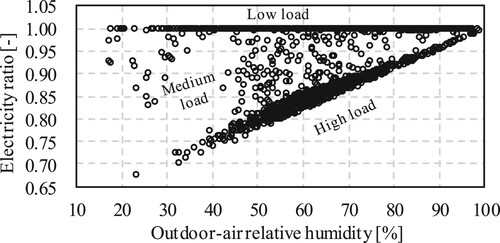
Table 16 Changes in compressor electricity consumption upon water spray.