Figures & data
Figure 1. Workflow of CityFFD (adopted from Mortezazadeh et al. Citation2022).
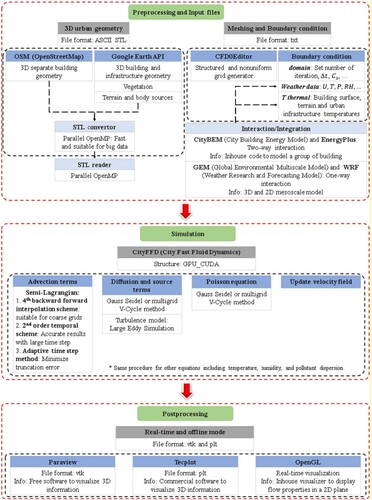
Figure 2. Workflow of CityBES.
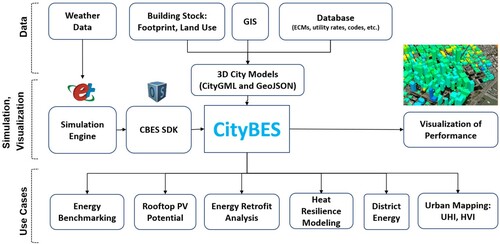
Figure 3. Data exchange between UBEM and UCM.
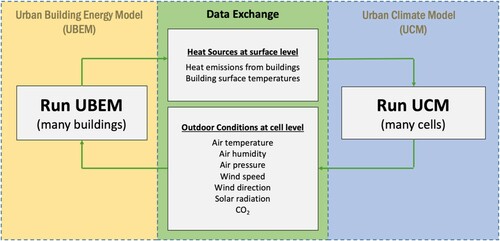
Figure 4. Illustration of the data exchange schema using five JSON files.
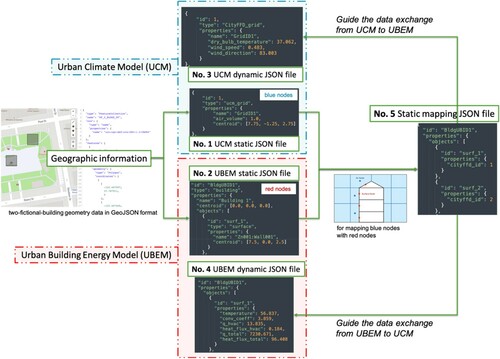
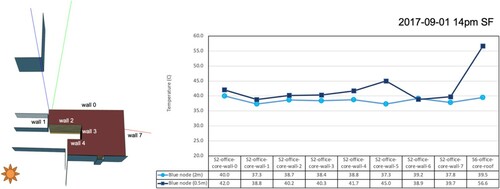
Figure 5. Mechanism of mapping the grid cells in UCM (blue nodes) with the building surfaces in UBEM (red nodes).
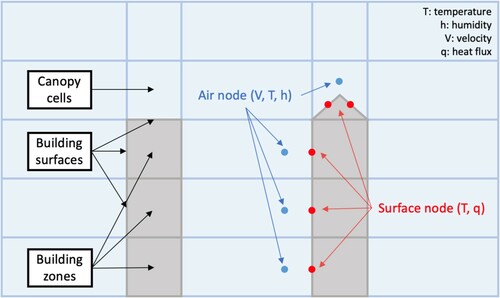
Figure 6. (a). One surface node (red) mapping to multiple air nodes (blue); (b): One air node (blue) mapping to multiple surface nodes (red).
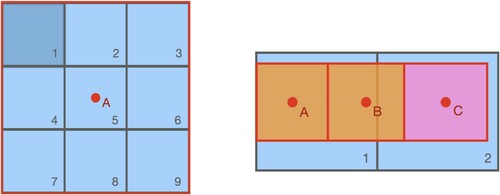
Figure 7. Workflow of the co-simulation between CityBES and CityFFD.
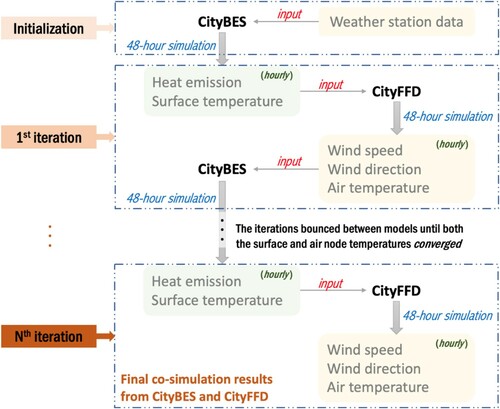
Figure 8. Static information description for (a) a surface node and (b) an air node, in JSON format.
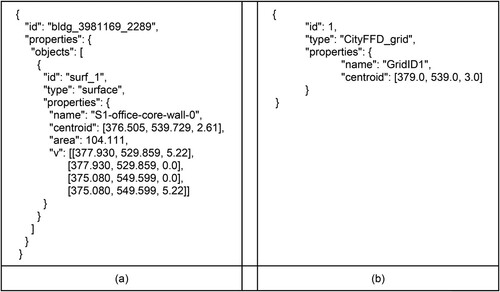
Figure 9. (a) Static mapping information for the simulation; (b) the run time data exchange file from surface nodes to air nodes; (c) the run-time data exchange file from air nodes (blue) to surface nodes (red).
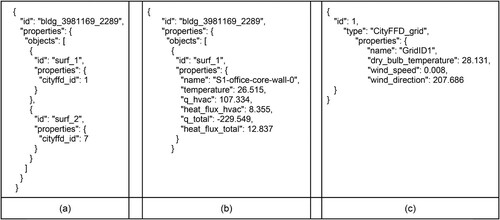
Figure 10. CityBES dataset of 97 buildings for the San Francisco case study. The weather station and the sample 20-floor office building are highlighted.
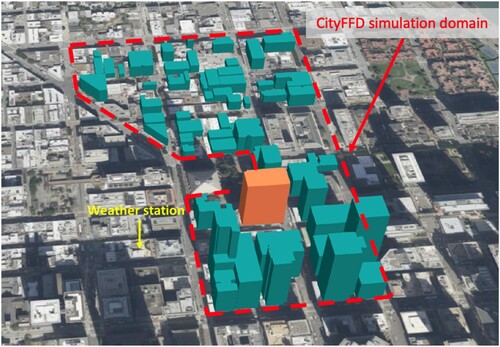
Figure 11. Simulation model in (a) CityBES and (b) CityFFD.
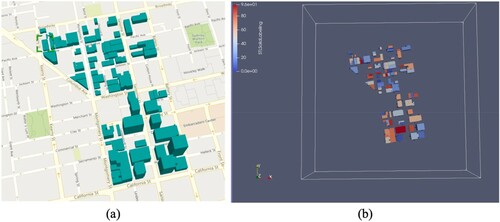
Figure 12. Average exterior surface temperatures of a sample office building.
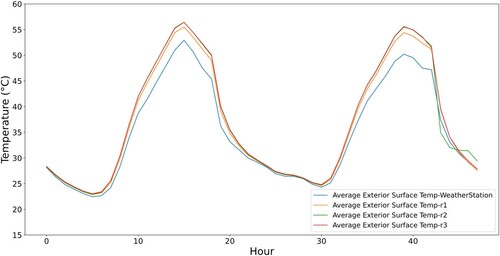
Figure 13. Average air temperature of local air nodes of a sample office building.
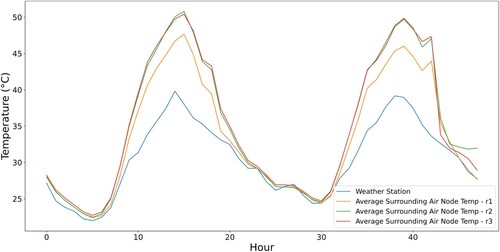
Figure 14. Hourly heat emission of a sample office building.
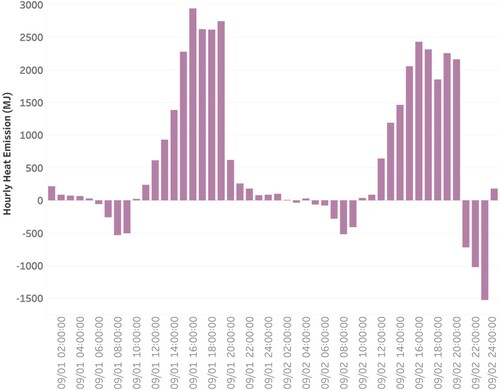
Figure 15. Ambient air temperature distribution of the entire simulation domain (at an elevation of 5 m) at morning, noon, afternoon, and midnight on September 1.
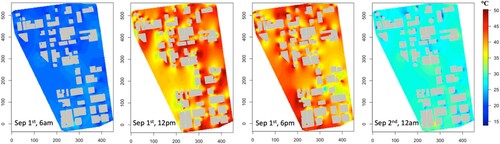
Figure 16. Comparison of the simulated hourly building cooling energy use with the static historical weather data and the dynamic simulated microclimate data.
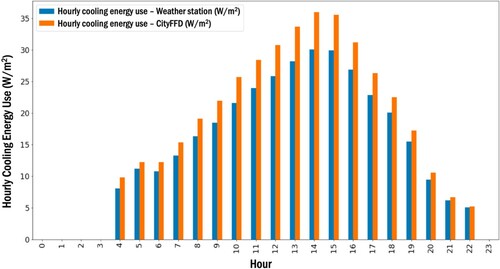
Figure 17. Comparison of the surface temperature under the grid resolution of 2 and 0.5 m in CityFFD.