
Figures & data
Table 1. Summary of previous studies on ensemble approaches for detecting and diagnosing building system faults.
Figure 1. Stacking classifier framework with a k-fold cross-validation schematic.
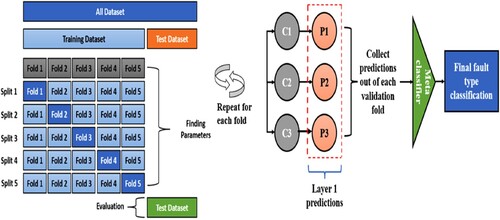
Figure 2. Layout of the applied methodology.
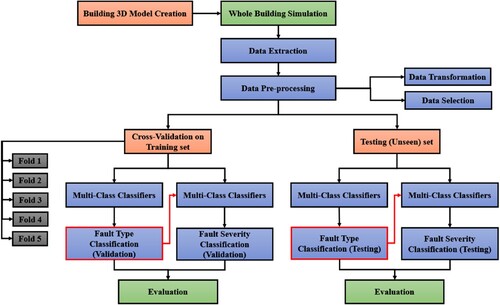
Figure 3. An illustration of a 3D model of the considered building.
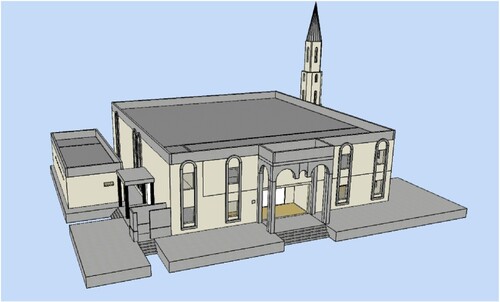
Table 2. Building construction and materials information.
Table 3. Building's window-to-wall ratio with respect to building orientation.
Figure 4. Packaged terminal air conditioner (PTAC).
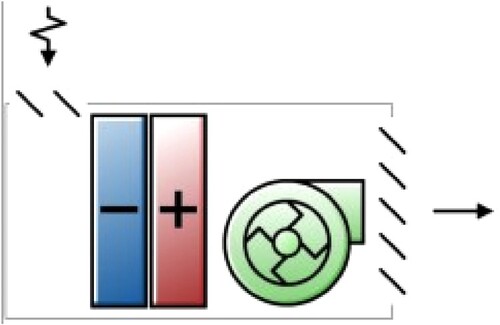
Table 4. System information and EnergyPlus basic input.
Figure 5. Simulated and measured monthly energy consumption.
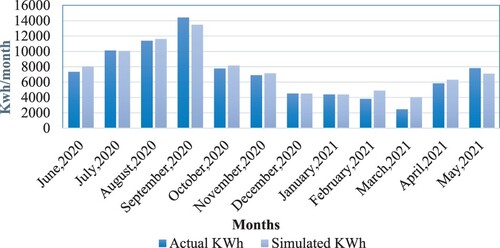
Figure 6. Average energy consumption per day.
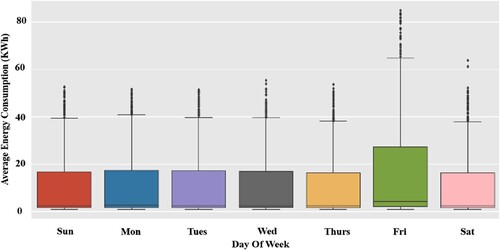
Figure 7. The simulated faults classes with different severities.
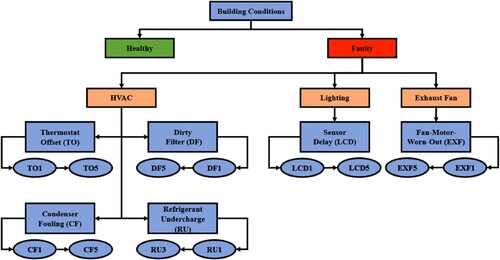
Table 5. Building’s simulated faults.
Figure 8. A schematic illustration of k-fold cross-validation on a dataset.
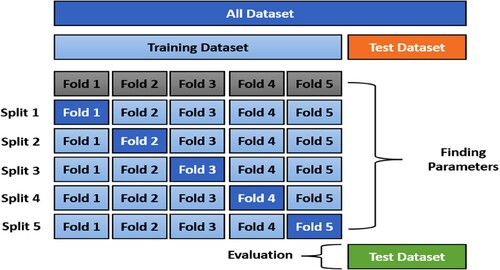
Figure 9. Time series decomposition components of one-year hourly energy consumption.
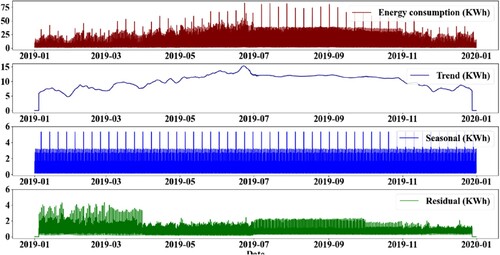
Figure 10. Importance of features in training data.
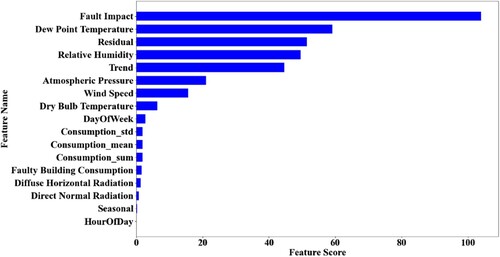
Figure 11. DT classification accuracy with the utilized number of features.
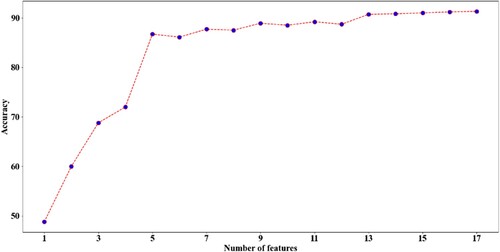
Table 6. Summary of main tuning parameters of each model.
Figure 12. The performance of classification models in classifying each fault type in the validation dataset.
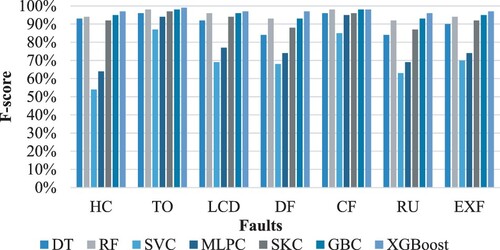
Figure 13. The performance of classification models in classifying each fault type in an unseen dataset.
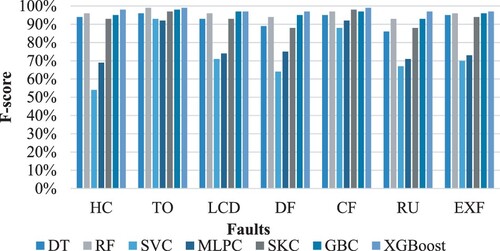
Figure 14. The performance of classification models in classifying the fault type and severity in the validation dataset.
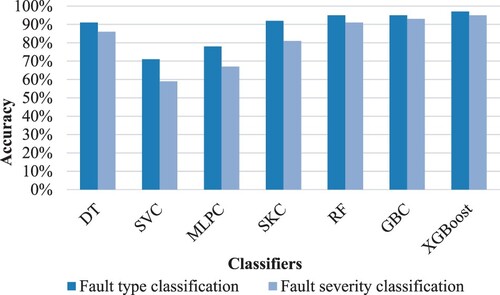
Figure 15. The performance of classification models in classifying the fault type and severity in an unseen dataset.

Table 7. A comparison of the model’s accuracy in relation to the utilization of data decomposition components.
Figure 16. A comparison of average classification accuracy with the runtime in minutes.
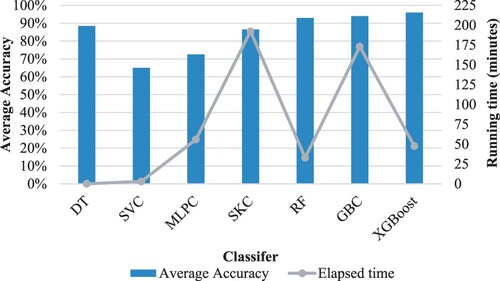
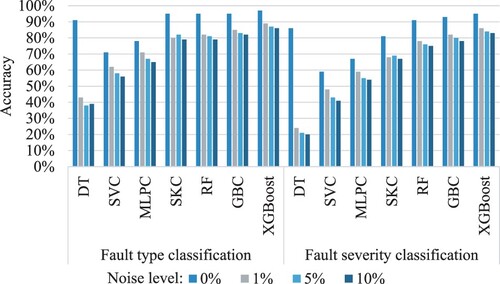
Figure 17. Classification accuracy of the proposed models under different noise levels.
Table
Data availability statement
The data that support the findings of this study are available from the corresponding author, [AYK], upon reasonable request.