
Figures & data
Figure 1. Selected heat dissipation systems for a hypothetical multi-story residential building. After removing heat from the conditioned spaces, hot water is stored first and pumped afterward to either the foundations or the roof to be cooled down through the available heat sink (the ground or the night sky)..
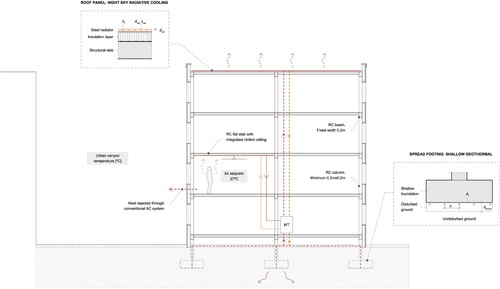
Figure 2. The proposed workflow allows for an early-stage evaluation of integrated urban heat sinks (in this paper, shallow geothermal through the foundations and a roof night sky radiator) and associated material impact.
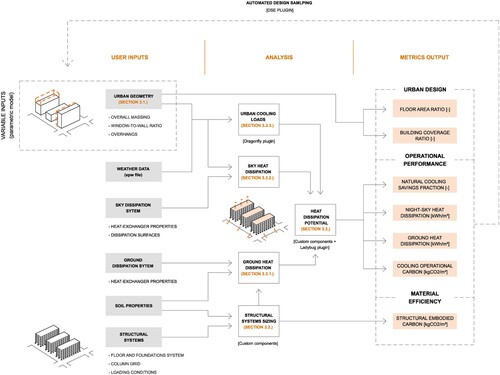
Figure 3. Geometric definition of the analyzed neighbourhood. Two urban design metrics – floor area ratio (FAR) and plan area density λp (also known as Building Coverage Ratio or BCR) – are calculated in the parametric worflow. Aplot refers to the area of the whole site (including the two open areas) and n to the number of floors.
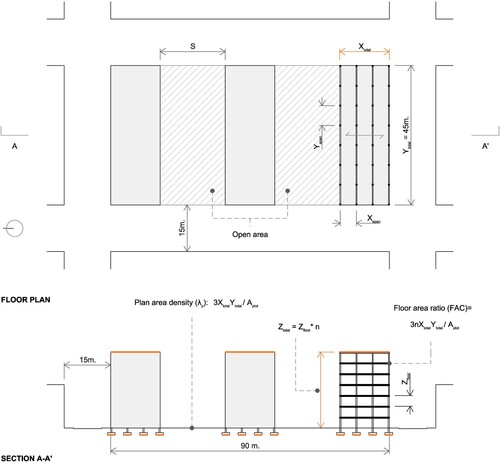
Table 1. Material properties for structural design and embodied carbon calculation *(Hammond and Jones Citation2019).
Figure 4. The ground sky view factor Fground is computed as the weighted average of the view factors Fi-sky calculated for each cell Ai within the meshed surface. The analyzed urban designs illustrate how the mean solar radiation Sm and the long wave radiation constant ΔR diminish as the ground's view factor reduces.
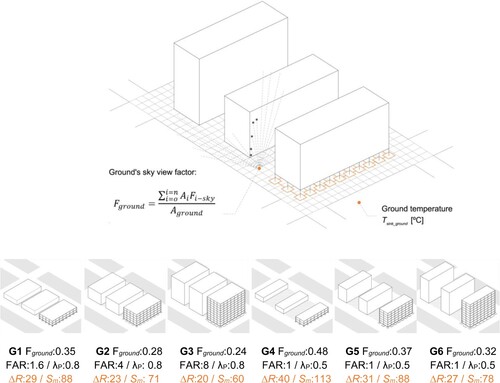
Figure 5. The radiator sky view factor Frad is computed as the weighted average of all the view factor Fi-sky calculated for each cell Ai within the meshed surface. The analyzed roof geometries illustrate how the mean heat dissipation qmean diminishes as the roof's exposure to the sky reduces due to neighbouring buildings or its self-shadowing.
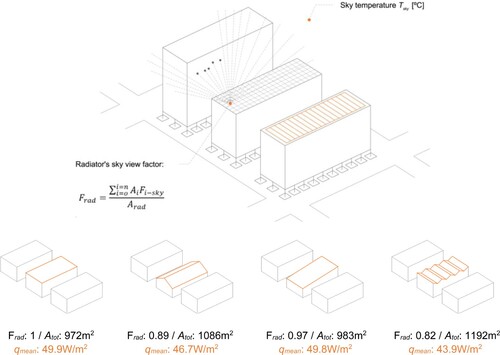
Table 2. UWG parameters.
Figure 6. Flowchart summary of the required inputs (fixed and variable), obtained metrics, and tools used throughout the multi-domain simulatoin framework. Values correspond to the case study presented in section 4.
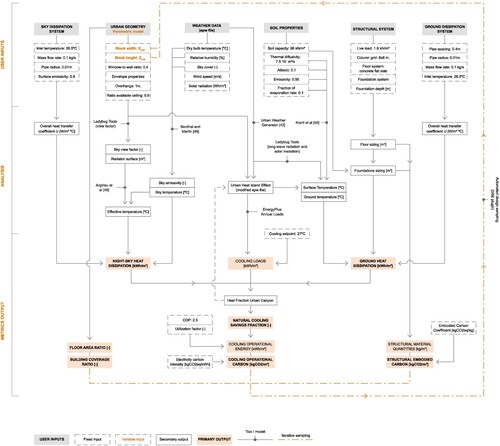
Figure 7. The structural embodied carbon increases linearly with FAR, as result of the higher foundation area Af.
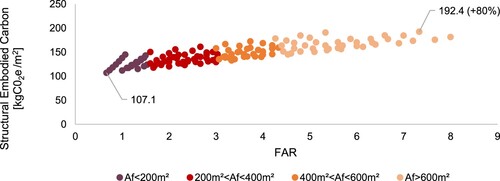
Table 3. Variables’ bounds.
Figure 8. The night sky cooling NCSF decreases with FAR for all climates given the lower ceiling-to-floor ratio. In constrast, the ground cooling NCSF increases with higher urban densities thanks to the larger foundation areas.
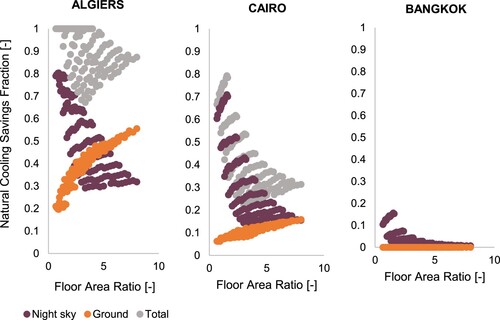
Figure 9. For a given climate, the structural-to-cooling carbon ratio largely depends on the building's cooling loads and ability to dissipate heat. In humid climates like Bangkok's, the operational carbon predominates due to the low performance of the selected systems and high loads, while in hot desertic climates (Algiers, Cairo), the embodied carbon is comparatively larger.
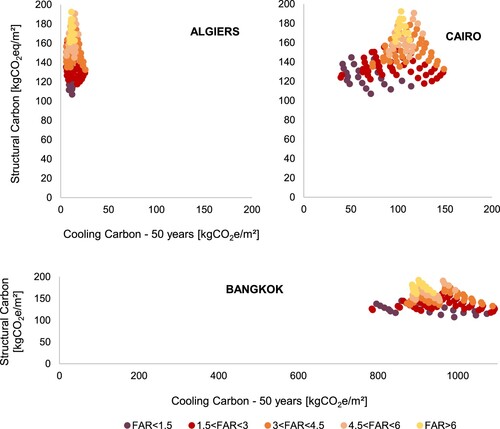
Figure 10. As expected, the designs’ carbon impact (combining structural and cooling carbon) increases with FAR. This tradeoff varies with λp, showing lower carbon emissions for equivalent FAR as the plan area density λp increases.
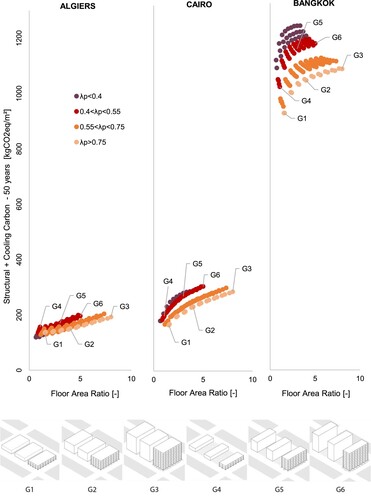
Figure 11. Summary of Natural Cooling Savings Fraction (NCSF) values for each heat dissipation system across FAR and plan area density (λp). The values for each table are not additive, as they may refere to different designs.
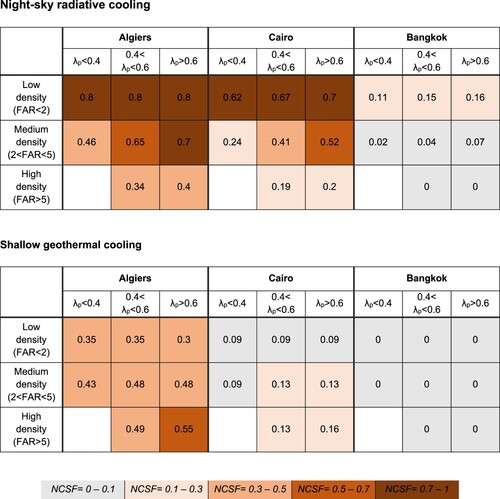
Figure 12. Predicted mean daily values for ground (2 m depth) and sky effective temperatures in Cairo's climate. The UHI values correspond to the urban geometry G2.
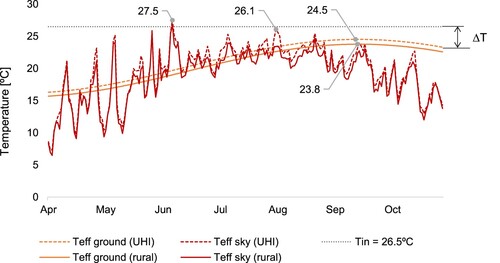
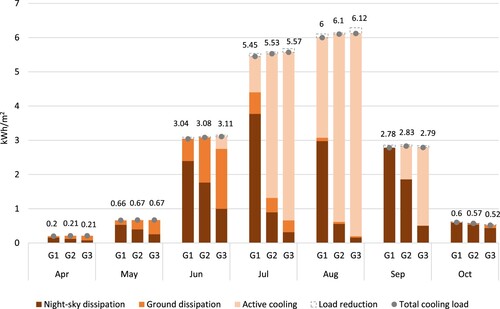
Figure 13. Cooling energy breakdowwn (active cooling, night-sky, and ground dissipation) across three different urban designs (G1, G2, and G3) with equal building plan area density (0.8) and increasing FAR (1.6, 4, and 8, respectively). As observed, the heat dissipations systems cover 100% of the cooling demand during the shoulder seasons for all geometries and a significant percentage during summer months for designs with lower FAR such as G1 (80% in July and 51% in August). Additionally, the total cooling load decreases by 1-3% compared to the baseline thanks to the reduction of heat released into the urban canyon.
Data availability statement
The data that support the findings of this study are available from the corresponding author upon reasonable request.