
Figures & data
Figure 1. Outline of the methodology used in the study.
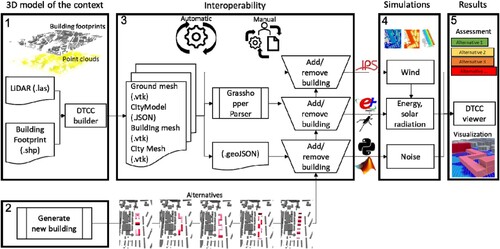
Figure 2. The area Gibraltarvallen where the blue rectangle marks the site where the different alternatives will be installed.
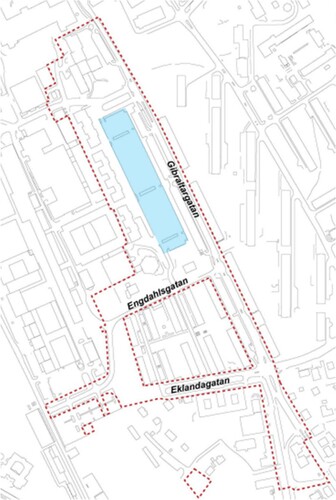
Figure 3. Site where the different alternatives will be installed.
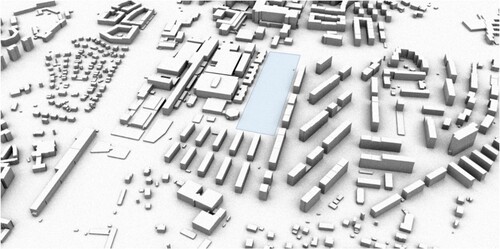
Figure 4. Base case without buildings and design alternatives with new buildings tested in the case study.
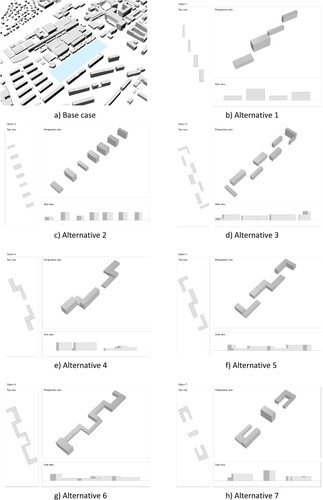
Figure 5. Wind comfort.
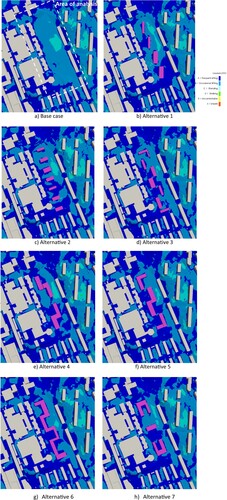
Figure 6. Yearly energy demand of the existing buildings in the base case.
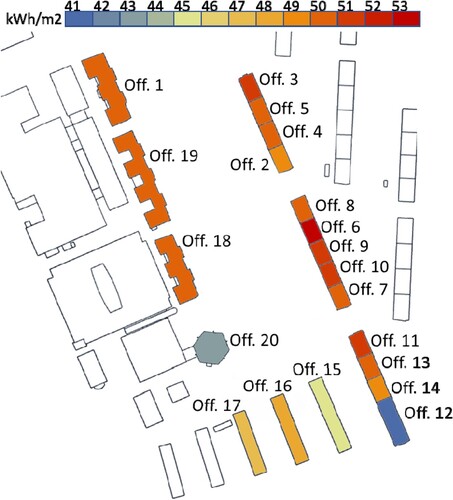
Figure 7. Change in energy demand of existing office buildings for each design alternative.
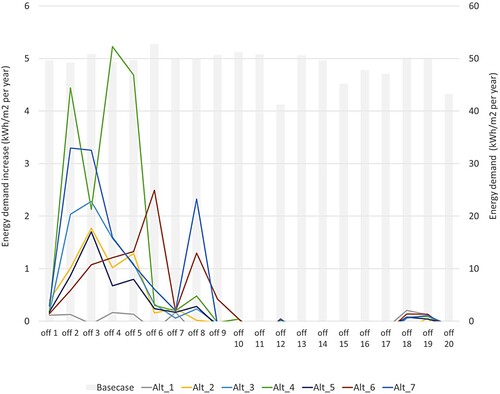
Figure 8. Solar radiation of the base case and delta between the solar radiation of the base case with each alternative.
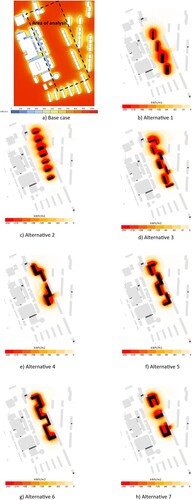
Figure 9. Grid noise maps for (a) base case without new buildings, and (b–h) different maps for design alternatives 1–7.
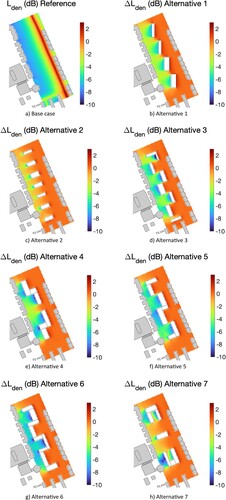
Figure 10. Change of performance indicators of each design alternative compared to the base case of the case study (positive values indicate increase in performance).
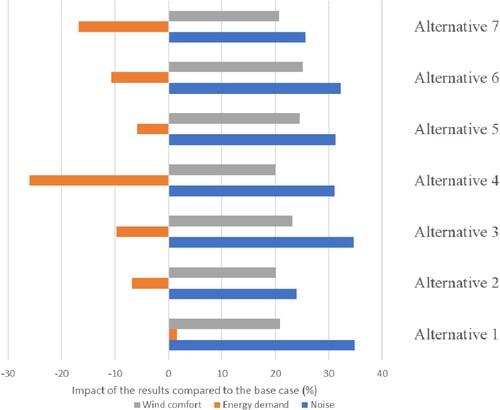
Table 1. Combined results for each design alternative.
Figure 11. Example representation of the combined visualization of wind comfort, building energy consumption and noise for design alternative 1. The top image shows energy, noise, and wind visualized together, whereas the bottom image visualizes energy and solar radiation.
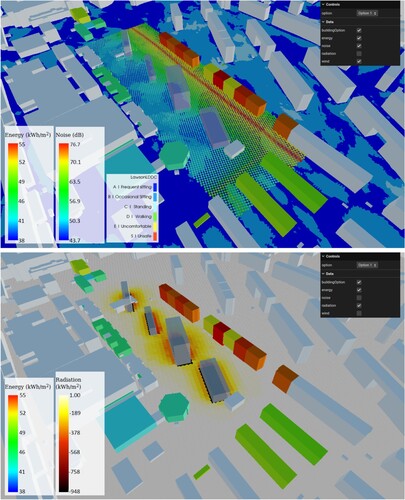
Figure A1. Streamlines across the target area, which can be seen in Figure (a).
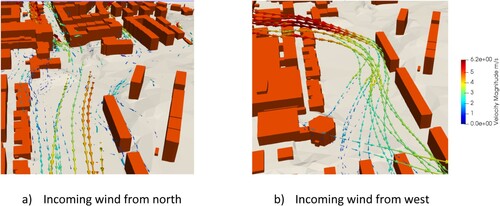
Figure A2. Wind pressures coefficient used for infiltration calculation in energy demand simulation, exemplary shown for northern wind for all design alternatives.

Data availability statement
The participants of this study did not give written consent for their data to be shared publicly, so due to the sensitive nature of the research supporting data is not available. Data can be made accessible by individual request to the authors.