3,657
Views
20
CrossRef citations to date
0
Altmetric
Reports

Protein design of IgG/TCR chimeras for the co-expression of Fab-like moieties within bispecific antibodies

, , , , , , , , & show all
Pages 364-376 | Received 27 Oct 2014, Accepted 09 Dec 2014, Published online: 11 Mar 2015

Figures & data

Figure 1. Schematic diagram of an IgG-Fab BsAb (A). Diagrams to the right of the correctly assembled IgG-Fab are potential mispairings related to the lack of LC specificity for a particularly HC Fd region. (B) Schematic diagram of the domain architecture of a α/β TCR. The receptor is a heterodimer consisting of 2 chains that each comprise a V-class and a C-class Ig-fold, much like an immunoglobulin Fab. (C) Superposition of the structures of an IgG1 CH1/Cκ heterodimer (pdb id: 3HC0) and the constant domains of an α/β TCR (pdb id: 3ARB). The structural homology between Cβ and Cκ as well as that between Cα and CH1 is apparent. (D) Diagram demonstrating the exchange of the CH1/Cκ domains with the TCR Cα/Cβ domains within an IgG1 antibody (denoted IgG_TCR).
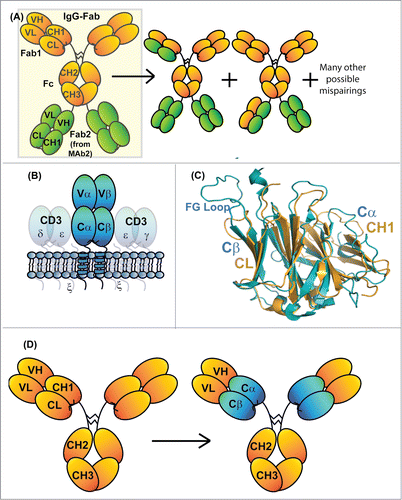
Figure 1. Schematic diagram of an IgG-Fab BsAb (A). Diagrams to the right of the correctly assembled IgG-Fab are potential mispairings related to the lack of LC specificity for a particularly HC Fd region. (B) Schematic diagram of the domain architecture of a α/β TCR. The receptor is a heterodimer consisting of 2 chains that each comprise a V-class and a C-class Ig-fold, much like an immunoglobulin Fab. (C) Superposition of the structures of an IgG1 CH1/Cκ heterodimer (pdb id: 3HC0) and the constant domains of an α/β TCR (pdb id: 3ARB). The structural homology between Cβ and Cκ as well as that between Cα and CH1 is apparent. (D) Diagram demonstrating the exchange of the CH1/Cκ domains with the TCR Cα/Cβ domains within an IgG1 antibody (denoted IgG_TCR).

Table 1. Biochemical characterization of initial IgG_TCRs

Figure 2. Characterization of initial IgG_TCR constructs. (A, B) SDS-PAGE analysis of IgG_TCR constructs under reducing, 10 mM DTT, (A) and non-reducing conditions (B). 15 μL of protein G magnetic bead purified protein from 2 mL 293F purifications was added to each lane. β1 and β2 differ in the N-terminal residues of the β-domain (β1 starts with E117, while β2 starts with K121). Similarly, α1 and α2 differ in the N-terminal residues of the α-domain (α1 starts with P116, while α2 starts with I118). (C) Non-reduced (left side of gel) and reduced (right side of gel) SDS-PAGE analysis of protein G pull-downs from supernatants expressed using mismatched and matched pairs of IgG and IgG_TCR heavy and light chains. (D) Cation exchange separation of IgG_TCR proteins secreted with 0 (1st peak), 1 (middle peak), or 2 (3rd peak) associated LCs. The inset shows the SDS-PAGE analysis of the 3 cation exchange fractions. (E) Binding activity of the protein fractions separated in (D), demonstrating the importance of LC association for binding to antigen. The association of the IgG_TCR protein can be observed between 300–600 s, while the antigen (IL-17 in this case) association can be observed between 800–1000 s. (F) Improvement in the uniform expression of fully paired (HC2LC2) IgG_TCR proteins after truncating the C-terminal tail of the β-constant domain of the LC. HC2LC2 elution time was at 13.5 minutes based on static light scattering analysis.
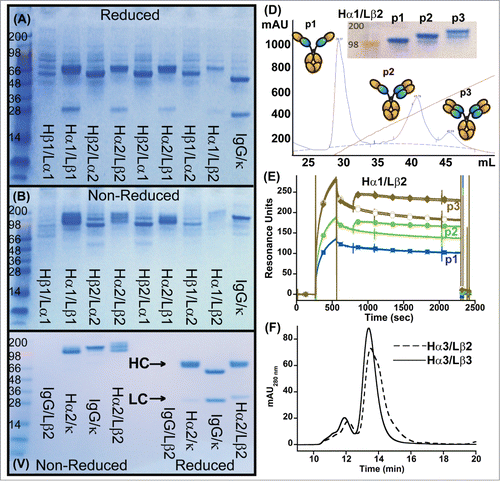
Figure 2. Characterization of initial IgG_TCR constructs. (A, B) SDS-PAGE analysis of IgG_TCR constructs under reducing, 10 mM DTT, (A) and non-reducing conditions (B). 15 μL of protein G magnetic bead purified protein from 2 mL 293F purifications was added to each lane. β1 and β2 differ in the N-terminal residues of the β-domain (β1 starts with E117, while β2 starts with K121). Similarly, α1 and α2 differ in the N-terminal residues of the α-domain (α1 starts with P116, while α2 starts with I118). (C) Non-reduced (left side of gel) and reduced (right side of gel) SDS-PAGE analysis of protein G pull-downs from supernatants expressed using mismatched and matched pairs of IgG and IgG_TCR heavy and light chains. (D) Cation exchange separation of IgG_TCR proteins secreted with 0 (1st peak), 1 (middle peak), or 2 (3rd peak) associated LCs. The inset shows the SDS-PAGE analysis of the 3 cation exchange fractions. (E) Binding activity of the protein fractions separated in (D), demonstrating the importance of LC association for binding to antigen. The association of the IgG_TCR protein can be observed between 300–600 s, while the antigen (IL-17 in this case) association can be observed between 800–1000 s. (F) Improvement in the uniform expression of fully paired (HC2LC2) IgG_TCR proteins after truncating the C-terminal tail of the β-constant domain of the LC. HC2LC2 elution time was at 13.5 minutes based on static light scattering analysis.

Table 2. Occupancy of predicted N-linked glycosylation sites

Figure 3. Effect of deleting N-linked glycosylation on HEK293 expression of IgG_TCR proteins. Reduced SDS-PAGE analysis (A) and analytical SEC (B) of fully glycosylated (WT) IgG_TCR, single N-linked glycosylation deletion mutants, double mutants, and a triple mutant after protein G pull-down from 2 mL HEK293 expression supernatants. (C) DSC analysis of fully glycosylated (WT) and single N-linked glycosylation deletion mutants of IgG_TCR proteins after 100 mL HEK293 scale-up and protein A purification.
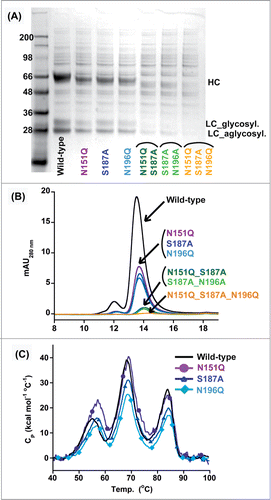
Figure 3. Effect of deleting N-linked glycosylation on HEK293 expression of IgG_TCR proteins. Reduced SDS-PAGE analysis (A) and analytical SEC (B) of fully glycosylated (WT) IgG_TCR, single N-linked glycosylation deletion mutants, double mutants, and a triple mutant after protein G pull-down from 2 mL HEK293 expression supernatants. (C) DSC analysis of fully glycosylated (WT) and single N-linked glycosylation deletion mutants of IgG_TCR proteins after 100 mL HEK293 scale-up and protein A purification.

Figure 4. Replacement of the FG loop from the β-constant domain with common β-turn motifs. (A) Stick diagram of the structure of the β-constant domain (from pdb 3QEU) where the FG loop is colored orange. Non-reduced (top) and reduced (bottom) SDS-PAGE analyses (B) and analytical SEC (C) of WT IgG_TCR, FG loop-deleted IgG_TCR, and IgG_TCRs with the FG loop replaced with a PS (proline_serine, Type I), NG (Type I’), and GN (Type II’) β-turn. The analyses in (B) and (C) were performed on IgG_TCR proteins expressed at the 2 mL scale in HEK293 and pulled down using protein G magnetic beads. (D) DSC analyses of WT IgG_TCR and FG loop replaced IgG_TCR after scale-up and protein A purification.
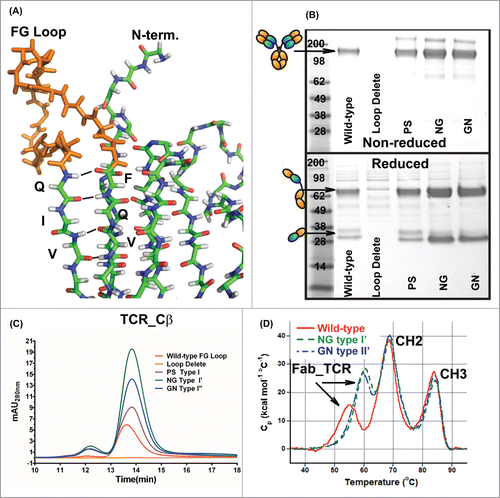
Figure 4. Replacement of the FG loop from the β-constant domain with common β-turn motifs. (A) Stick diagram of the structure of the β-constant domain (from pdb 3QEU) where the FG loop is colored orange. Non-reduced (top) and reduced (bottom) SDS-PAGE analyses (B) and analytical SEC (C) of WT IgG_TCR, FG loop-deleted IgG_TCR, and IgG_TCRs with the FG loop replaced with a PS (proline_serine, Type I), NG (Type I’), and GN (Type II’) β-turn. The analyses in (B) and (C) were performed on IgG_TCR proteins expressed at the 2 mL scale in HEK293 and pulled down using protein G magnetic beads. (D) DSC analyses of WT IgG_TCR and FG loop replaced IgG_TCR after scale-up and protein A purification.

Figure 5. Biophysical characterization of HER2×HER2 IgG-Fab BsAbs produced using IgG_TCR modalities to direct LC assembly. Panels A and B are non-reduced (left) and reduced (right) SDS-PAGE analysis and analytical SEC, respectively, of C-BsAb and N-BsAbs. Panels E and F are an evaluation of the HER-2 binding properties of trastuzumab IgG_TCR, pertuzumab IgG_TCR, C-BsAb, and N-BsAb by analyzing their ability to block 40 nM HER-2 from binding surfaces labeled with IgG1 trastuzumab (C) or pertuzumab (D). Panels E and F are intact mass spectrometry analyses of C-BsAb and N-BsAb, respectively under reducing conditions. The N-BsAb contained the VL_Y36F mutation and VL_Q38D/VH_Q39K to reduce the affinity of the trastuzumab LC for the pertuzumab Fd containing Cα/Cβ. The spectra show the levels of LC within the IgG-Fab BsAbs. The HC was heavily N- and O-glycosylated; therefore, non-reduced spectra were complex.
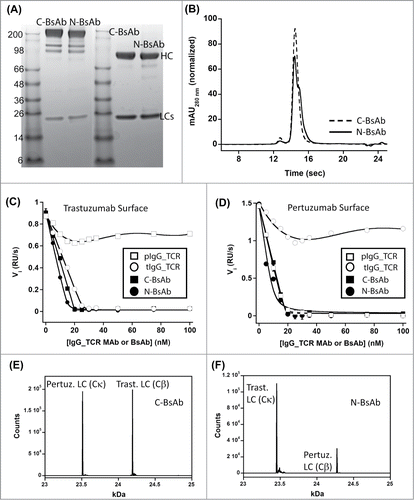
Figure 5. Biophysical characterization of HER2×HER2 IgG-Fab BsAbs produced using IgG_TCR modalities to direct LC assembly. Panels A and B are non-reduced (left) and reduced (right) SDS-PAGE analysis and analytical SEC, respectively, of C-BsAb and N-BsAbs. Panels E and F are an evaluation of the HER-2 binding properties of trastuzumab IgG_TCR, pertuzumab IgG_TCR, C-BsAb, and N-BsAb by analyzing their ability to block 40 nM HER-2 from binding surfaces labeled with IgG1 trastuzumab (C) or pertuzumab (D). Panels E and F are intact mass spectrometry analyses of C-BsAb and N-BsAb, respectively under reducing conditions. The N-BsAb contained the VL_Y36F mutation and VL_Q38D/VH_Q39K to reduce the affinity of the trastuzumab LC for the pertuzumab Fd containing Cα/Cβ. The spectra show the levels of LC within the IgG-Fab BsAbs. The HC was heavily N- and O-glycosylated; therefore, non-reduced spectra were complex.

Figure 6. Biological activity of IgG_TCR BsAbs. The effect of IgG_TCR BsAbs on the FBS-driven proliferation of (A) BT-474 breast cancer cells (top) and N87 gastric cancer cells (bottom). (B) Western blot analyses of the phosphorylated state of EGFR, HER-2, HER-3, Akt, and Erk from N87 tumor cells grown for 48 hours in FBS in the presence of various anti-HER-2 monoclonal and bispecific antibodies. Additionally, the presence of cleaved PARP was evaluated on the blot. Actin was probed to demonstrate the normalized amount of protein loaded into each well.
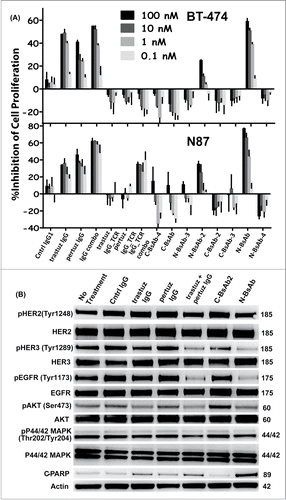
Figure 6. Biological activity of IgG_TCR BsAbs. The effect of IgG_TCR BsAbs on the FBS-driven proliferation of (A) BT-474 breast cancer cells (top) and N87 gastric cancer cells (bottom). (B) Western blot analyses of the phosphorylated state of EGFR, HER-2, HER-3, Akt, and Erk from N87 tumor cells grown for 48 hours in FBS in the presence of various anti-HER-2 monoclonal and bispecific antibodies. Additionally, the presence of cleaved PARP was evaluated on the blot. Actin was probed to demonstrate the normalized amount of protein loaded into each well.
Supplemental material

supplemental_KMAB_A_1007826.zip

Download Zip (2.8 MB)

Reprints and Corporate Permissions

Please note: Selecting permissions does not provide access to the full text of the article, please see our help page How do I view content?

To request a reprint or corporate permissions for this article, please click on the relevant link below:

Academic Permissions

Please note: Selecting permissions does not provide access to the full text of the article, please see our help page How do I view content?

Obtain permissions instantly via Rightslink by clicking on the button below:

If you are unable to obtain permissions via Rightslink, please complete and submit this Permissions form. For more information, please visit our Permissions help page.