Figures & data
Figure 1. Characterization of Pan. (A) SDS-PAGE analysis of purified Pan under nonreducing (8% polyacrylamide gel) and reducing (12% polyacrylamide gel) conditions. Lane 1, Pan; lane 2, panitumumab; M, Protein Marker. (B) Competitive binding assay. Pan and panitumumab was evaluated in ELISA for their ability to compete with biotin-conjugated panitumumab for binding to coating EGFR-Fc. Points, mean of 3 independent determinations; Bars, SEM. (C) Proliferation of A431 cells grown in the presence of increasing concentrations of panitumumab or Pan. Points, mean of 3 independent CCK-8 assays; Bars, SEM.
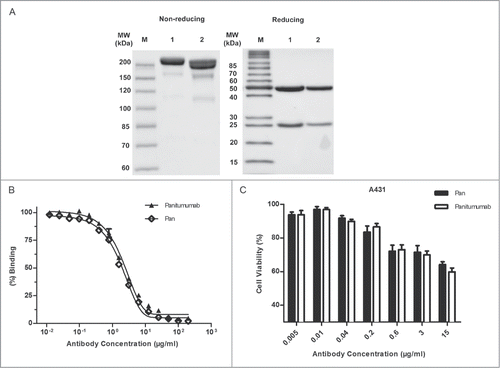
Figure 2. Pan shows superior ADCC activity compared with Panitumumab. (A) Quantitation of N-glycosylation species of Pan, as determined by Mass Biopharmalynx 1.3.3 software. Percentage represents the presence of different glyco-species in total glycan. (B) Activation of NFAT-luciferase reporter in Jurkat cell expressing the FcγRIIIa complex by Pan (1 μg/mL), panitumumab (1 μg/mL) or cetuximab (1 μg/mL). Samples without mAbs were controls. These assays were performed in triplicate, and the data are the mean ± SEM (***, P < 0.001). (C) Jurkat/FcγRIIIa/NFAT-Luc cells were co-incubated in the presence of serially diluted Pan, panitumumab or cetuximab. Luciferase activity (the fold of induction compared to the control sample without mAbs) is represented on the graphs. (D) BALB/c nude mice received subcutaneous injections of A431 cells on day 0. Starting on day 1 (arrow), mice were treated twice weekly by intraperitoneal injections of panitumumab (50 mg/kg), Pan (50 mg/kg), or control IgG (50 mg/kg). Tumors were measured using a caliper and tumor growth was monitored every 3 days for n = 6 mice per group.
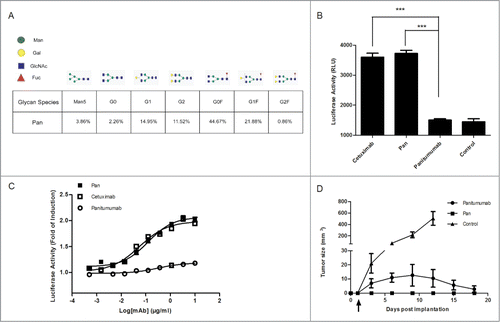
Figure 3. Design and in vitro proteolytic cleavage of Pan-P. (A) Schematic representation of Pan-P showing the blocking peptide, uPA substrate region, flexible peptide linkers and IgG1 backbone. (B) SDS-PAGE analysis of Pan-P before (lane 2) and after proteolytic cleavage with uPA (lane 1). Pan was used as control (lane 3). (C) Validation of sequence-specific cleavage in Pan-P when incubated with uPA by LC/MS analysis.
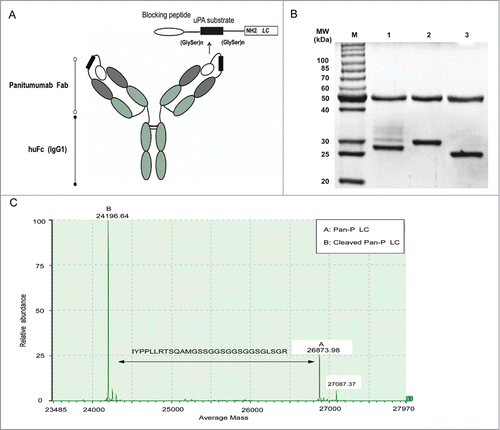
Figure 4. In vitro activation of Pan-P. (A) Pan-P exhibited reduced binding to immobilized EGFR by ELISA, whereas digestion of Pan-P with uPA (activated Pan-P) restored binding comparable to Pan. The data are shown as the mean ± SEM. EC50 for Pan, Pan-P, and activated Pan-P are 0.117 μg/mL (95% confidence interval [CI], 0.1039–0.1309 μg/mL), 2.694 μg/mL (95% CI, 2.359–3.075 μg/mL), and 0.1452 (95% CI, 0.1099–0.1918 μg/mL), respectively. (B) Kinetic parameters and affinity determinations of Pan, Pan-P and activated Pan-P for EGFR ECD measured by Biacore T100. (C) Inhibitory effect of increasing concentrations of Pan, Pan-P, or activated Pan-P on the proliferation of A431 cells. The data are shown as the mean ± SEM. (D) CCK-8 assay comparing the effects of Pan, Pan-P and activated Pan-P on DiFi cell proliferation. IC50 for Pan, Pan-P, and activated Pan-P are 0.054 μg/mL (95% CI, 0.048–0.061 μg/mL), 0.53 μg/mL (95% CI, 0.46–0.62 μg/mL), 0.059 μg/ml (95% CI, 0.055–0.063 μg/mL). Bars, SEM.
![Figure 4. In vitro activation of Pan-P. (A) Pan-P exhibited reduced binding to immobilized EGFR by ELISA, whereas digestion of Pan-P with uPA (activated Pan-P) restored binding comparable to Pan. The data are shown as the mean ± SEM. EC50 for Pan, Pan-P, and activated Pan-P are 0.117 μg/mL (95% confidence interval [CI], 0.1039–0.1309 μg/mL), 2.694 μg/mL (95% CI, 2.359–3.075 μg/mL), and 0.1452 (95% CI, 0.1099–0.1918 μg/mL), respectively. (B) Kinetic parameters and affinity determinations of Pan, Pan-P and activated Pan-P for EGFR ECD measured by Biacore T100. (C) Inhibitory effect of increasing concentrations of Pan, Pan-P, or activated Pan-P on the proliferation of A431 cells. The data are shown as the mean ± SEM. (D) CCK-8 assay comparing the effects of Pan, Pan-P and activated Pan-P on DiFi cell proliferation. IC50 for Pan, Pan-P, and activated Pan-P are 0.054 μg/mL (95% CI, 0.048–0.061 μg/mL), 0.53 μg/mL (95% CI, 0.46–0.62 μg/mL), 0.059 μg/ml (95% CI, 0.055–0.063 μg/mL). Bars, SEM.](/cms/asset/f1074fd5-a02f-4f5d-b3bf-6cd44fa001d0/kmab_a_1008352_f0004_b.gif)
Figure 5. Analysis of Pan-P and Pan binding to human CRC sections using fluorescence microscopy. (A) Representative fluorescent immunostaining showed Pan-P was activated and bound in EGFR-positive colorectal carcinoma specimens. AF680-labeled Pan and Pan-P were incubated with frozen tissue sections of human primary colorectal cancer. After 2 hours of incubation, positive staining (red) validated Pan-P and Pan bound to EGFR in colorectal carcinoma specimens (left panel); however, preincubation of panitumumab blocked the binding positions of Pan and Pan-P (right panel) on EGFR. With preincubation of protease inhibitor, Pan-P binding fluorescent signal was inhibited as Pan binding signal remained unchanged (middle panel). 4’,6-Diamidino-2-phenylindole (DAPI) nuclear staining appears in blue. (B) Statistical analysis of immunoreaction positive cells in colorectal carcinoma specimens was shown when incubated with indicated antibody. (*, P < 0.05; **, P < 0.01; ***, P < 0.001). Data represent mean and SEM of the integrated fluorescence signals from 3 fields for each specimen. Significance is confirmed using unpaired 2-sided Student's t-test (C) Representative micrographs of fluorescent immunostaining showed reduced binding of Pan-P for normal colorectal mucosa adjacent to tumor compared with Pan. Pan-positive staining indicated the presence of EGFR expression in both tumor tissues and adjacent nontumorous mucosa tissues. Pan-P positive staining was observed only in colorectal carcinoma specimens, while no significant signal was detected from adjacent normal colorectal mucosa. (D) Percentage of positive stained cells decreased markedly in adjacent normal colorectal mucosa when incubated with Pan-P. In contrast, Pan remained binding to adjacent section to some extent. (*, P < 0.05; **, P < 0.01). Data are expressed as mean ± SEM of the integrated fluorescence signals from 3 fields for each specimen. Original magnification, ×400. Scale bars, 50 μm.
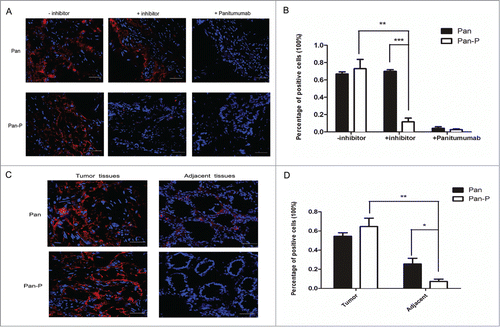
Figure 6. In vivo activation of Pan-P in BALB/c nude mice with A431 tumor xenograft. (A) Validation of AF680 labeled Pan (lane 2), Pan-P (lane 4) and Pan-C (lane 6) by reducing SDS-PAGE (upper: Coomassie brilliant blue staining, lower: fluorescence). Unlabeled Pan (lane 1), Pan-P (lane 3) and Pan-C (lane 5) were used as controls. (B) In vivo fluorescence imaging of representative mice bearing A431 xenografts from intraperitoneal injection of AF680 labeled Pan (left), Pan-P (middle) and Pan-C (right). The lower panel indicated the tumor localization.
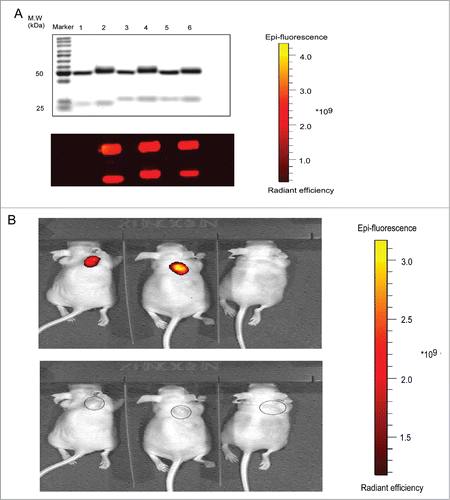
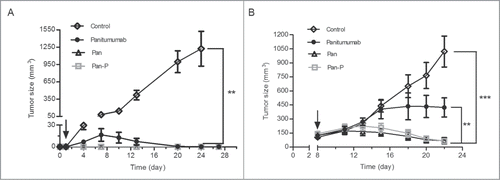
Figure 7. Pan-P inhibits the in vivo growth of A431 cancer cell line. (A, B) Mean tumor volumes of mice xenografted with A431 cells and treated with Pan (50 mg/kg), Pan-P (50 mg/kg), panitumumab (50 mg/kg) or control IgG (50 mg/kg) in prophylactic (A) or established (B) tumor models. There were 6 animals per treatment group. Tumor cells were injected at day 0, and antibody treatment started as indicated in the graphs (black arrow). Error bars show ± SEM. (**P < 0.01; ***P < 0.001).
