Figures & data
Figure 1. (A) Reaction mechanism of carboxyl footprinting. Mass spectrum of (B) light chain of unlabeled mAb with a charge state of +19. (C) Labeled form showing the incorporation of GEE label with a mass shift of +85; about 11% of the light chain gets labeled.
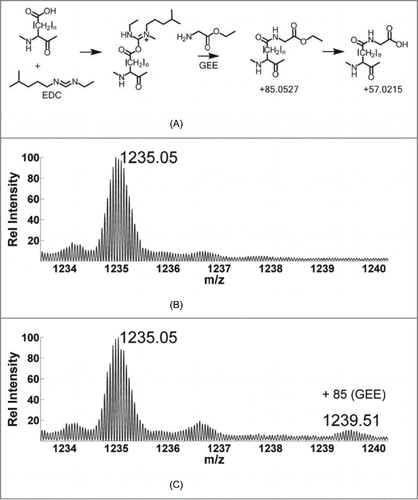
Table 1. Summary of the concentrations of EDC relative to the protein concentration under different conditions of labeling
Table 2. Summary of labeling results for mAb monomer. First column includes peptide sequencing numbering, second column includes GEE labeling rate constants and the associated error bars, third column indicates labeled probes as detected by MS2 together with their Solvent Accessible Surface Area (SASA) values, and the fourth column shows the unlabeled probes from the same peptide with their SASA values (*: Site of modification could not be precisely localized
Figure 2. Dose response plots for select mAb HC peptides from triplicate runs shown with dashed lines, the solid line shows the best fit for the three replicates.
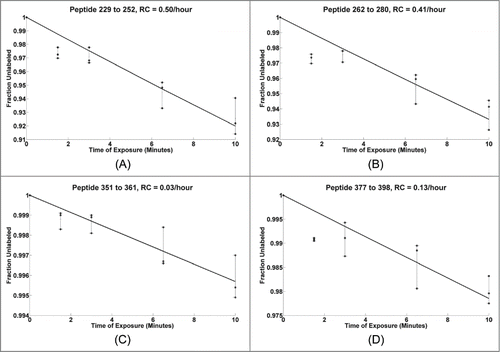
Figure 3. Dose response plots for mAb HC peptides at 10 times higher concentration of EDC, with black line showing the best theoretical fit to the first order reaction. Note: Typically, the DR curves are carefully observed for any saturation behavior (non-linearity) in each individual peptide DR curve. Such non-linearity indicates that the high dose is potentially altering structure. Thus, DR plots are truncated at high dose levels if evidence of such saturation is occurring. In general the lowest dose points are the most accurate and representative of the intact biological state.
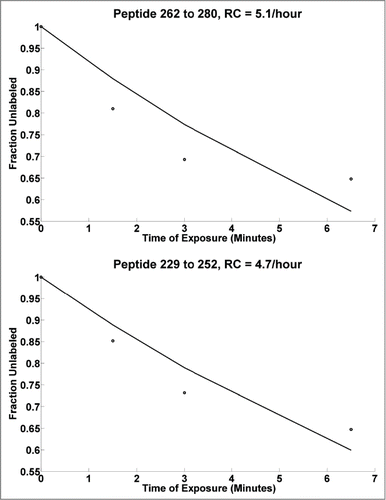
Figure 4. Homology model of mAb structure. GEE labeled residues marked in red spheres. Inset: HC region representing peptide 88-98, where E89 is highly solvent accessible (shown in red) and is modified, while D90 (blue) has limited solvent accessibility and was not detected as labeled.
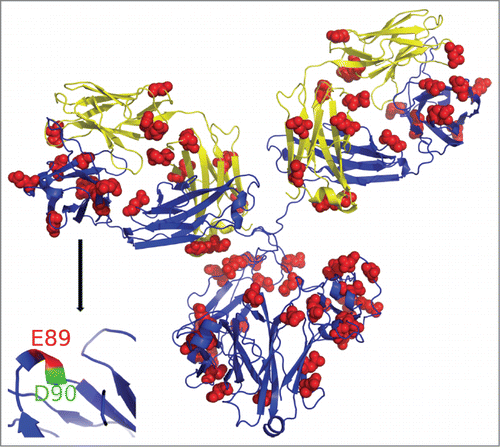
Figure 5. Dose response rate constants of all peptides as a function of the total solvent accessibility area of the constituent D/E residues.
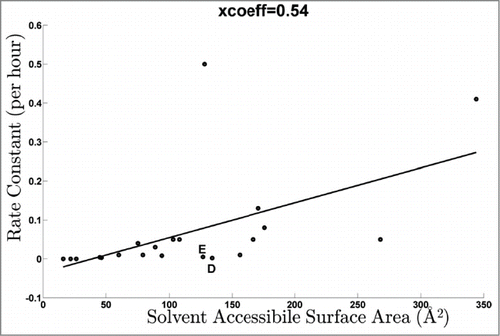
Table 3. Summary of labeling from peptide experiments (% of overall modified species)
Figure 6. Single ion chromatograms of unlabeled and +85 labeled form of synthetic peptides. (A) GIDTPQIESR peptide showing modified isoforms of D3 and E8 at 23.3 and 24.3 minutes, with C-term at 24.8 and 25.4 minutes. (B) DIQMTQSPSR peptide showing two isoforms representing labeled C-terminus and D1+85 eluting at 20.8 and 21.4 minutes, respectively. (C) EVQPVESGGR peptide showing the unlabeled and labeled forms of the cyclized peptide showing a water loss. Two similar sized distinct peaks at 24.75 and 24.06 minutes represent +85 modification at C-terminus and E6, respectively.
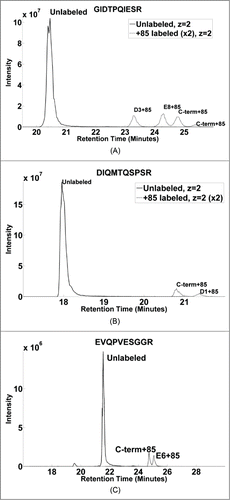
Table 4. Comparison of labeling results of oxidative and carboxyl footprinting experiments. (A) Summary of sequence coverage using two approaches. (B) Examples of specific peptides showing different relative reaction kinetics in each case depending upon the solvent accessibility of the probes
