Figures & data
Figure 1. Model for the mechanism of action of TAC. As depicted in the model, (1) TAC binds to S. aureus bacteria, (2) TAC bound S. aureus bacteria are internalized by professional phagocytes or other host cells such as epithelial cells. After (3) phagosome-lysosome fusion, (4) lysosomal cathepsins cleave the linker, which (5) releases the active antibiotic dmDNA31 attacking the intracellular bacteria, resulting in (6) elimination of the bacteria.
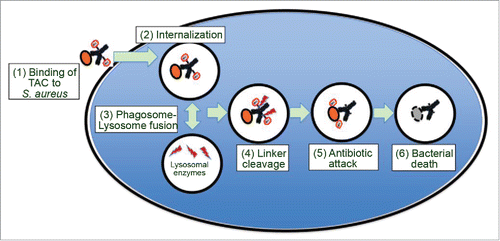
Figure 2. Three analytes measured for PK ccharacterization. The figure depicts the analyte mixtures for ac-dmDNA31 and TAC total antibody. The gray areas indicate parts of TAC structure that would not be measured by the respective assay. The colored areas indicate parts of TAC structure that would be determined by each assay. Catabolites of TAC other than unconjugated dmDNA31 may be present in circulation. DAR = drug-to-antibody ratio.
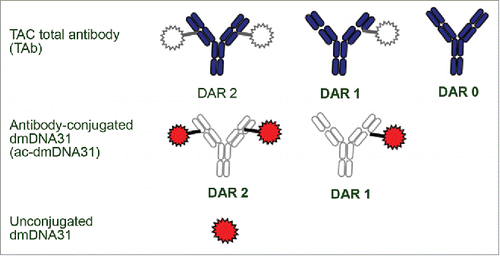
Figure 3. Plasma concentration−time profiles of unconjugated (naked) anti-S. aureus antibody following IV administration of unconjugated anti-S. aureus antibody in non-infected mice.
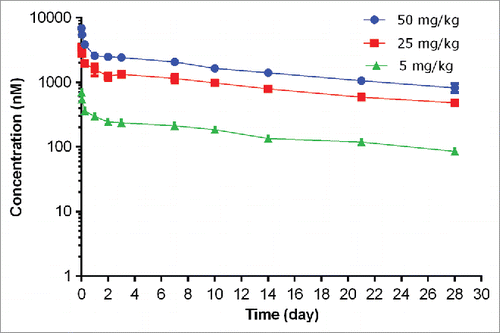
Table 1. Non-compartmental PK parameters following a single IV administration of unconjugated (naked) anti-S. aureus antibody in non-infected mice and mice infected with S. aureus.
Figure 4. Plasma concentration−time profiles of unconjugated (naked) anti-S. aureus antibody following IV administration of unconjugated anti-S. aureus antibody in mice infected with S. aureus.
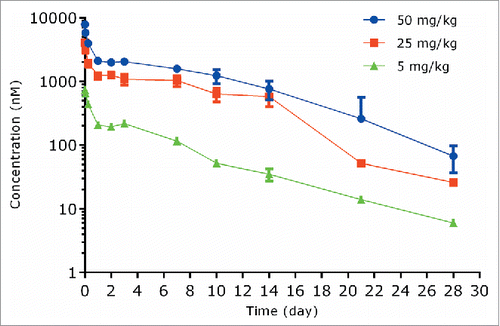
Figure 5. Plasma concentration-time profiles of TAC total antibody (TAb) (A) and antibody-conjugated dmDNA31 (ac-dmDNA31) (B) following IV administration of TAC in non-infected mice.
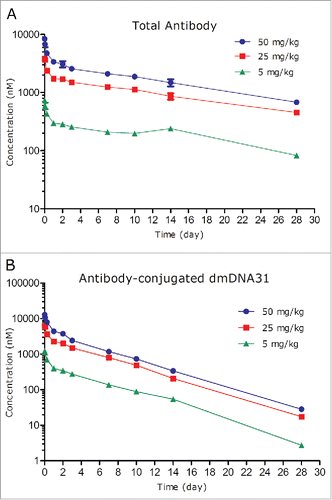
Table 2. Non-compartmental PK parameters of TAC TAb and ac-dmDNA31 following a single IV administration of TAC in non-infected mice.
Table 3. Non-compartmental PK parameters of unconjugated dmDNA31 following a single IV administration of TAC in non-infected mice.
Figure 6. Plasma concentration−time profiles of TAC total antibody (TAb) (A) and antibody-conjugated dmDNA31 (ac-dmDNA31) (B) following IV administration of TAC in mice infected with S. aureus.
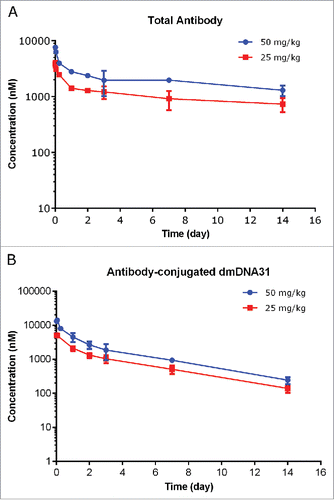
Table 4. Non-compartmental PK parameters of TAC TAb and ac-dmDNA31 following a single IV administration of TAC in mice infected with S. aureus.
Table 5. Non-compartmental PK parameters of unconjugated dmDNA31 following a single IV administration of TAC mice infected with S. aureus.
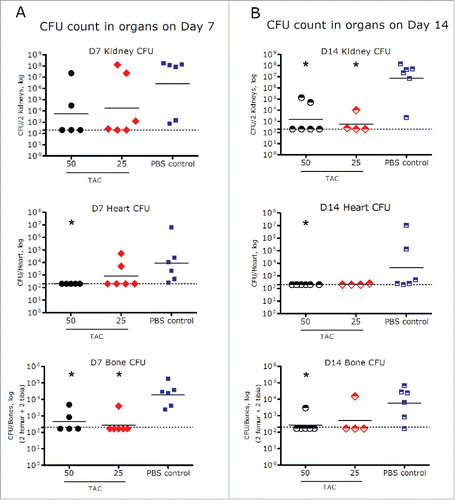
Figure 7. Bacterial load in heart, kidneys, and bones on day 7 (A) and day 14 (B) after a single IV administration of TAC or PBS control in mice infected with S. aureus. *p < 0.05 compared to PBS control (Mann-Whitney test). Dots represent the CFU of the organs from individual infected animals; black dashes represent the group geometric mean. Dash line: Limit of detection (250 CFU/organ for heart and kidney, and 167 CFU/organ for bones).
