Figures & data
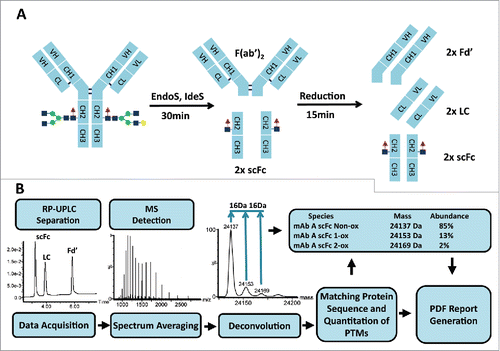
Figure 1. Workflow for subunit mass analysis: sample preparation (A) followed by automated RP-UPLC-MS analysis (B).

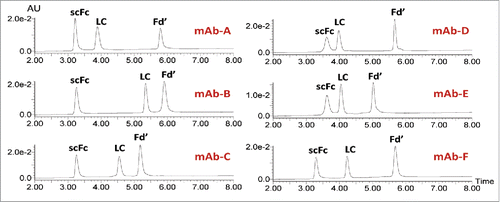
Figure 2. RP-UPLC analysis of IgG subunits from IgG1 (mAbs-A, B, and C), IgG4 (mAbs-D and E) and IgG2 (mAb-F).

Figure 3. Impact of oxidation on the elution profiles of mAb subunits. UPLC profiles are presented for the mAb-A control sample and samples treated with 250µM and 750 µM peracetic acid for 2 hr at 30°C (top to bottom).

Figure 4. Overlaid deconvoluted mass spectra of the scFc subunit from mAb-A treated with different concentration of peracetic acid (A). To generate oxidized samples for analysis, mAb-A was incubated for 2 hr at 30°C with increasing concentrations of peracetic acid (0–500 µM). The sum of 1-ox, 2-ox and 3-ox species shown in panel A was plotted as a function of peracetic acid concentration (B).

Figure 5. Correlation of scFc oxidation results by peptide mapping and subunit mass analysis. Levels of Met257, Met363 and Met433 oxidation quantified by peptide mapping were plotted as a function of total oxidation on scFc quantified by subunit mass analysis.

Figure 6. Three subunits of mAb-B with indicated methionine residues and corresponding deconvoluted mass spectra for the sample treated with 500µM peracetic acid (A). The sum of 1-ox and 2-ox species in Panel A was plotted as a function of peracetic acid concentration (B).

Figure 7. Correlation between percent total oxidation on LC quantified using subunit mass analysis and percent oxidation on LC Met32 and MC50 by peptide mapping.

Table 1. Summary of assay qualification results. The average results ± 3 SDs and the RSDs are presented from subunit mass experiments using two different columns performed on three different days by two different analysts.
Figure 8. Comparison of scFc methionine oxidation induced by chemical and photo stress. Deconvoluted mass spectra for the scFc subunit of mAb-A are presented for the unstressed control (A), peracetic acid stressed sample (B) and photo stressed sample (C). Structural model of the CH2:CH3 interface showing close proximity of HC Met257 and HC Met433 in mAb-A (D).

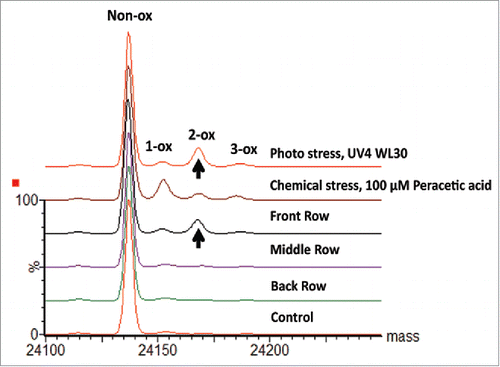
Figure 9. Deconvoluted spectra of mAb-A DP samples. Overlaid deconvoluted mass spectra of mAb-A scFc subunits are presented for samples collected from different positions in the vial tray along with results from photo and chemically stressed samples.

Table 2. Quantitation results of mAb-A DP samples. Results are presented for mAb-A samples collected from different positions in the vial tray along with results from photo and chemically stressed samples.
