2,066
Views
11
CrossRef citations to date
0
Altmetric
Reports

bisFabs: Tools for rapidly screening hybridoma IgGs for their activities as bispecific antibodies

, , , , , , , , , & show all
Pages 430-437 | Received 16 Sep 2016, Accepted 07 Jan 2017, Published online: 16 Mar 2017

Figures & data

Figure 1. Schematic diagram showing the main steps involved in producing bispecific bisFabs from murine IgGs. Purification steps are indicated in green font. The inter-chain disulfide bonds are indicated in orange. (a) The purified IgGs are digested with the proteases indicated in . to generate F(ab’)2. (b) Reduction with TCEP releases the monomeric Fab’ molecules and reduces the heavy-light chain disulfide bond. (c) Re-oxidation of the thiol groups re-form the heavy-light disulfide bond while cyclizing a pair of cysteines in the hinge, leaving a single reduced cysteine. (d) The reoxidized Fab’ is reacted with an excess of bismaleimide crosslinker. (e) the resulting modified Fab’ is conjugated to a second Fab’ with a different specificity.
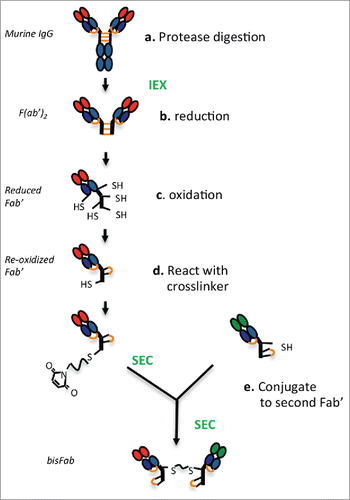
Figure 1. Schematic diagram showing the main steps involved in producing bispecific bisFabs from murine IgGs. Purification steps are indicated in green font. The inter-chain disulfide bonds are indicated in orange. (a) The purified IgGs are digested with the proteases indicated in Table 1. to generate F(ab’)2. (b) Reduction with TCEP releases the monomeric Fab’ molecules and reduces the heavy-light chain disulfide bond. (c) Re-oxidation of the thiol groups re-form the heavy-light disulfide bond while cyclizing a pair of cysteines in the hinge, leaving a single reduced cysteine. (d) The reoxidized Fab’ is reacted with an excess of bismaleimide crosslinker. (e) the resulting modified Fab’ is conjugated to a second Fab’ with a different specificity.

Table 1. Enzymes used to generate F(ab’)2s from the different murine isotypes.

Figure 2. Biochemical characterization of a representative purified bisFab. (A) Non-reducing SDS-PAGE. The table indicates the structures of the corresponding bands as deduced based on the mass spectrometry analysis. The species indicated with asterisks are likely bisFabs missing one S-S bond between a heavy and light chain that dissociates under denaturing conditions. The light gray chain in the structure indicates the dissociated chain. The relative abundance of each band was determined by densitometry of 30 independent bisFabs and shown is the range observed for each band. (B) Analytical size-exclusion chromatography. The Table shows the observed range of aggregation and low molecular weight fragments obtained for the panel of bisFabs and the molar masses calculated by multi-angle laser light scattering. (C) Mass spectrometry analysis showing mass deconvolution between 20 kDa and 120 kDa, and (D), a zoom-in of the mass spectrometry analysis in the 98 kDa area. Homodimers were absent or below 2%.
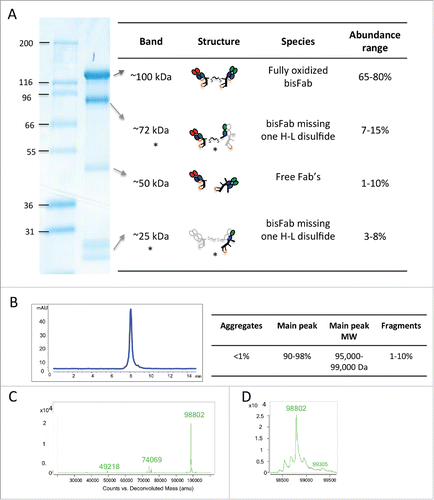
Figure 2. Biochemical characterization of a representative purified bisFab. (A) Non-reducing SDS-PAGE. The table indicates the structures of the corresponding bands as deduced based on the mass spectrometry analysis. The species indicated with asterisks are likely bisFabs missing one S-S bond between a heavy and light chain that dissociates under denaturing conditions. The light gray chain in the structure indicates the dissociated chain. The relative abundance of each band was determined by densitometry of 30 independent bisFabs and shown is the range observed for each band. (B) Analytical size-exclusion chromatography. The Table shows the observed range of aggregation and low molecular weight fragments obtained for the panel of bisFabs and the molar masses calculated by multi-angle laser light scattering. (C) Mass spectrometry analysis showing mass deconvolution between 20 kDa and 120 kDa, and (D), a zoom-in of the mass spectrometry analysis in the 98 kDa area. Homodimers were absent or below 2%.

Figure 3. Comparison of T-cell recruiting antibodies using 3 separate anti-HER2 antibody clones (A: 4D5, B: 2C4, C: 7C2) in either full-length IgG (blue line) or bisFab format (red line). Shown is the percentage of target cell (SKBR-3) killing in the presence of human PBMCs and different concentrations of the antibodies. Values are the mean ± standard deviation of 3 replicate experiments. The calculated EC50 and extent of maximum killing are: (A) IgG: 0.24 pM, 95%; bisFab: 0.07 pM, 95%; (B) IgG: 0.14 pM, 90%; bisFab: 0.06 pM, 90%; (C) IgG: 46 pM, 65%; bisFab: 129 pM, 62%.

Figure 3. Comparison of T-cell recruiting antibodies using 3 separate anti-HER2 antibody clones (A: 4D5, B: 2C4, C: 7C2) in either full-length IgG (blue line) or bisFab format (red line). Shown is the percentage of target cell (SKBR-3) killing in the presence of human PBMCs and different concentrations of the antibodies. Values are the mean ± standard deviation of 3 replicate experiments. The calculated EC50 and extent of maximum killing are: (A) IgG: 0.24 pM, 95%; bisFab: 0.07 pM, 95%; (B) IgG: 0.14 pM, 90%; bisFab: 0.06 pM, 90%; (C) IgG: 46 pM, 65%; bisFab: 129 pM, 62%.

Figure 4. T-cell killing activity of 3 antibodies against B-cell targets (A: anti-CD20, B: anti-CD79 clone A, C: anti-CD79 clone B). Antibodies in the full-length IgG format (blue line) or bisFabs (red line) were tested against BJAB cells in an in vitro cell killing assay using human PBMCs. Values are the average of duplicate experiments ± standard deviation. The calculated EC50 and extent of maximum killing are: (A) IgG: 1.9 pM, 85%; bisFab: 0.8 pM, 85%; (B) IgG: 200 pM, 80%; bisFab: 49 pM, 75%; (C) IgG: 920 pM, 78%; bisFab: 65 pM, 67%.

Figure 4. T-cell killing activity of 3 antibodies against B-cell targets (A: anti-CD20, B: anti-CD79 clone A, C: anti-CD79 clone B). Antibodies in the full-length IgG format (blue line) or bisFabs (red line) were tested against BJAB cells in an in vitro cell killing assay using human PBMCs. Values are the average of duplicate experiments ± standard deviation. The calculated EC50 and extent of maximum killing are: (A) IgG: 1.9 pM, 85%; bisFab: 0.8 pM, 85%; (B) IgG: 200 pM, 80%; bisFab: 49 pM, 75%; (C) IgG: 920 pM, 78%; bisFab: 65 pM, 67%.

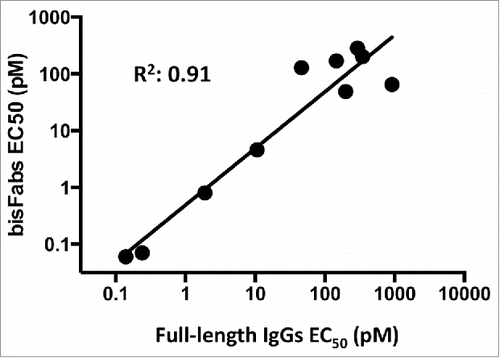
Figure 5. Correlation between the potencies of antibodies in the bisFab or full-length IgG formats. EC50 numbers obtained from the fitted dose-response curves for the full-length IgG or bisFab constructs were transformed to their log10 values and analyzed by linear regression.

Figure 5. Correlation between the potencies of antibodies in the bisFab or full-length IgG formats. EC50 numbers obtained from the fitted dose-response curves for the full-length IgG or bisFab constructs were transformed to their log10 values and analyzed by linear regression.
Supplemental material

Supplemental_Figures_1-7___Supplemental_Table_1.pptx

Download MS Power Point (18 MB)

Reprints and Corporate Permissions

Please note: Selecting permissions does not provide access to the full text of the article, please see our help page How do I view content?

To request a reprint or corporate permissions for this article, please click on the relevant link below:

Academic Permissions

Please note: Selecting permissions does not provide access to the full text of the article, please see our help page How do I view content?

Obtain permissions instantly via Rightslink by clicking on the button below:

If you are unable to obtain permissions via Rightslink, please complete and submit this Permissions form. For more information, please visit our Permissions help page.