5,303
Views
60
CrossRef citations to date
0
Altmetric
Reports

In-silico prediction of concentration-dependent viscosity curves for monoclonal antibody solutions

, , , , , & show all
Pages 476-489 | Received 14 Nov 2016, Accepted 18 Jan 2017, Published online: 23 Feb 2017

Figures & data

Table 1. Concentration dependent viscosity data on 16 mAbs used in this study.Footnote*

Table 2. Experimentally observed values of parameters A and B for the 16 mAbs.Footnote*

Figure 1. Experimentally determined concentration-dependent viscosity behaviors for the 16 antibodies in our database (). Dots are experimentally obtained data points while lines are least square fits to the data using equation Equation3. c is the concentration of the antibody in the solution, η is the viscosity of the solution, and η0 is the viscosity of the platform formulation buffer. All the antibody molecules show exponential dependence of viscosity on concentration, as is clear from the R2 values in . As a guide to the eye, well-behaved antibodies are shown in green, poorly-behaved antibodies are shown in red, and rest of the antibodies are shown in blue.
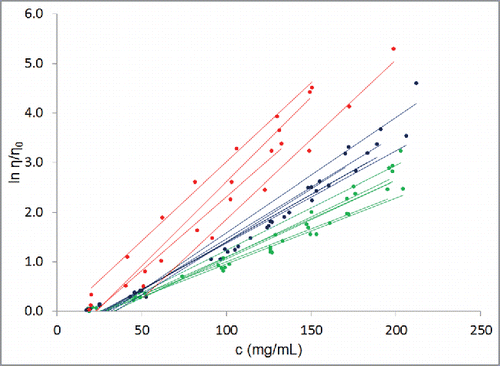
Figure 1. Experimentally determined concentration-dependent viscosity behaviors for the 16 antibodies in our database (Table 1). Dots are experimentally obtained data points while lines are least square fits to the data using equation Equation3(3) lnηη0=ln A +Bc (3) . c is the concentration of the antibody in the solution, η is the viscosity of the solution, and η0 is the viscosity of the platform formulation buffer. All the antibody molecules show exponential dependence of viscosity on concentration, as is clear from the R2 values in Table 2. As a guide to the eye, well-behaved antibodies are shown in green, poorly-behaved antibodies are shown in red, and rest of the antibodies are shown in blue.

Figure 2. Concentration-dependent viscosity behaviors of 4 antibodies of IgG1λ isotype. Dots represent experimental data, c is concentration in mg/mL, and η is viscosity in cP. Lines are guide to the eye. These 4 mAbs of the same isotype show different concentration-dependent viscosity behaviors. mAb5 and mAb9 have considerably lower viscosity behaviors than mAb14 and mAb16. Therefore, viscosity behaviors of antibody molecules are encoded in their amino acid sequences at a finer level than isotypes.
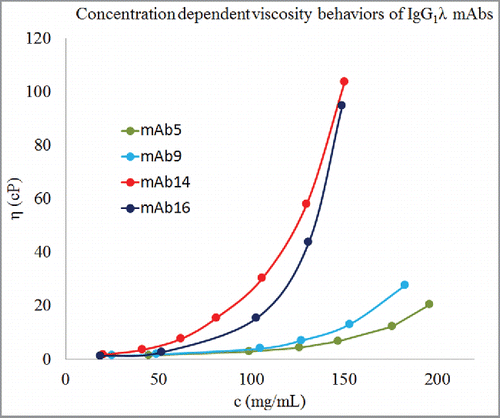
Figure 2. Concentration-dependent viscosity behaviors of 4 antibodies of IgG1λ isotype. Dots represent experimental data, c is concentration in mg/mL, and η is viscosity in cP. Lines are guide to the eye. These 4 mAbs of the same isotype show different concentration-dependent viscosity behaviors. mAb5 and mAb9 have considerably lower viscosity behaviors than mAb14 and mAb16. Therefore, viscosity behaviors of antibody molecules are encoded in their amino acid sequences at a finer level than isotypes.

Table 3. Correlation coefficient (R), square of correlation coefficient (R2) obtained from a linear regression between experimentally derived value of parameter B and each computationally estimated descriptor. The results from t-tests for the significance of the correlations are also shown and significant correlations are highlighted. Footnote*

Figure 3. Prediction using Eq. Equation1. The model was trained on the full data set (Left Panel). The model was trained after leaving one antibody molecule out of the data set (Right Panel). The error bars have the same size as 95% confidence intervals. BExp refers to the experimentally obtained values of the parameter B while BPred refers to the prediction made using Eq. 1.
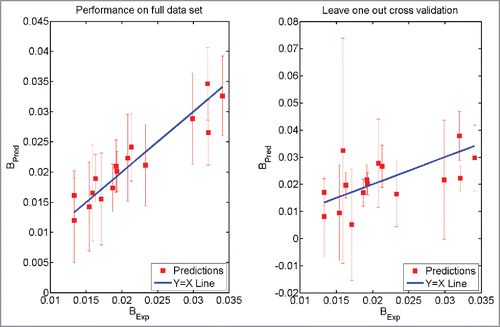
Figure 3. Prediction using Eq. Equation1(1) B = 1+ x3*x7 +x3*x13 +x5*x7 +x7*x13(1) . The model was trained on the full data set (Left Panel). The model was trained after leaving one antibody molecule out of the data set (Right Panel). The error bars have the same size as 95% confidence intervals. BExp refers to the experimentally obtained values of the parameter B while BPred refers to the prediction made using Eq. 1.

Figure 4. Comparison of experimentally observed and predicted concentration-dependent viscosity behaviors of 3 representative antibodies. The parameter B is obtained after training Eq. Equation1 on the complete data set. The parameter A is taken as the average of A values for all the antibodies (i.e., 0.58, as listed in ). An antibody with low viscosity (mAb3), an antibody with moderate viscosity (mAb9), and an antibody with high viscosity (mAb16) are shown in this figure. Dashed lines are predictions made using one standard deviation about the predicted value of B. Similar concentration-dependent viscosity behavior curves can be constructed for any antibody in the database after the parameter B is predicted using Eq. Equation1. Further examples for predicted concentration-dependent viscosity behaviors are provided in Section 3 in Supporting Information.
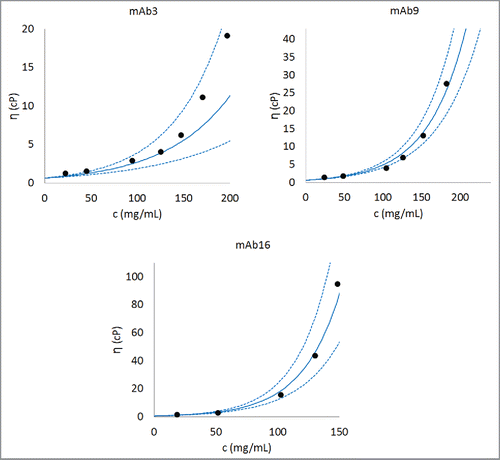
Figure 4. Comparison of experimentally observed and predicted concentration-dependent viscosity behaviors of 3 representative antibodies. The parameter B is obtained after training Eq. Equation1(1) B = 1+ x3*x7 +x3*x13 +x5*x7 +x7*x13(1) on the complete data set. The parameter A is taken as the average of A values for all the antibodies (i.e., 0.58, as listed in Table 2). An antibody with low viscosity (mAb3), an antibody with moderate viscosity (mAb9), and an antibody with high viscosity (mAb16) are shown in this figure. Dashed lines are predictions made using one standard deviation about the predicted value of B. Similar concentration-dependent viscosity behavior curves can be constructed for any antibody in the database after the parameter B is predicted using Eq. Equation1(1) B = 1+ x3*x7 +x3*x13 +x5*x7 +x7*x13(1) . Further examples for predicted concentration-dependent viscosity behaviors are provided in Section 3 in Supporting Information.

Figure 5. Prediction of concentration-dependent viscosity behavior of an antibody currently under development at Pfizer. The experimental data are shown as black circles and the predictions are shown as curve. The parameter B was predicted using Eq. Equation1. This predicted value of B and average value of A () was used for creating the concentration-dependent viscosity curves from Eq. Equation2. For comparison predictions using the real value of A for TestmAb (0.73) are also shown. Equation Equation1 is correctly able to predict the concentration-dependent viscosity behavior of TestmAb. Moreover, the agreement between predicted and experimentally observed viscosity behavior improves when the real value of A for TestmAb is used. The dotted red lines are viscosity predictions using the real value of A for TestmAb (0.73) and within one standard deviation about the predicted value of B.
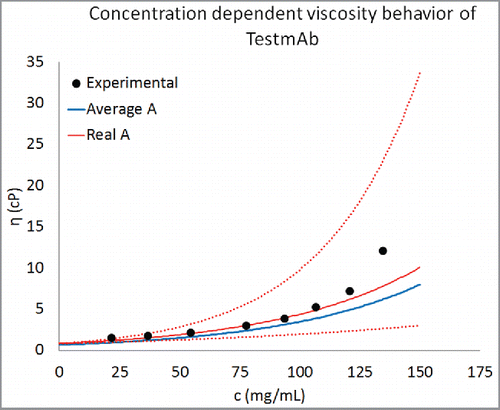
Figure 5. Prediction of concentration-dependent viscosity behavior of an antibody currently under development at Pfizer. The experimental data are shown as black circles and the predictions are shown as curve. The parameter B was predicted using Eq. Equation1(1) B = 1+ x3*x7 +x3*x13 +x5*x7 +x7*x13(1) . This predicted value of B and average value of A (Table 2) was used for creating the concentration-dependent viscosity curves from Eq. Equation2(2) ηη0= A exp Bc(2) . For comparison predictions using the real value of A for TestmAb (0.73) are also shown. Equation Equation1(1) B = 1+ x3*x7 +x3*x13 +x5*x7 +x7*x13(1) is correctly able to predict the concentration-dependent viscosity behavior of TestmAb. Moreover, the agreement between predicted and experimentally observed viscosity behavior improves when the real value of A for TestmAb is used. The dotted red lines are viscosity predictions using the real value of A for TestmAb (0.73) and within one standard deviation about the predicted value of B.

Figure 6. Hinge region sequence alignment of human IgG1, IgG2, and IgG4 antibodies. Note that number of charged residues in the hinge regions of different isotypes is different.

Figure 6. Hinge region sequence alignment of human IgG1, IgG2, and IgG4 antibodies. Note that number of charged residues in the hinge regions of different isotypes is different.

Table 4. Steps followed in this scheme to develop viscosity prediction algorithm. Analogous schemes can be used to develop predict viscosity behaviors of antibodies for different formulations (different buffers, excipients and pH).

Figure 7. Concentration-dependent viscosity curves for 3 commercially developed antibody molecules using the descriptors from homology models. Equation Equation1 was used to predict the parameter B for these antibody molecules and average values of A was taken from . All 3 antibody molecules were predicted to show viscosity less than 20 cP at concentrations greater than 150 mg/mL.
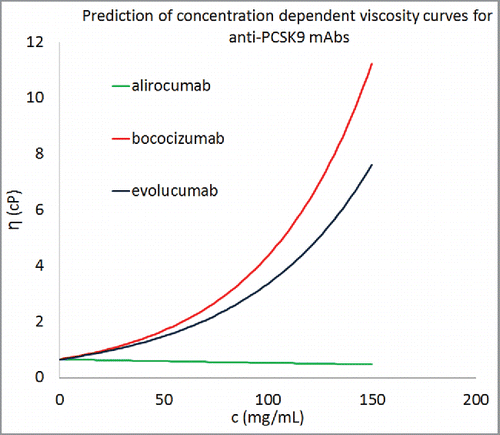
Figure 7. Concentration-dependent viscosity curves for 3 commercially developed antibody molecules using the descriptors from homology models. Equation Equation1(1) B = 1+ x3*x7 +x3*x13 +x5*x7 +x7*x13(1) was used to predict the parameter B for these antibody molecules and average values of A was taken from Table 2. All 3 antibody molecules were predicted to show viscosity less than 20 cP at concentrations greater than 150 mg/mL.
Supplemental material

Supplemental_Figure_1___Tables_1-2.docx

Download MS Word (1 MB)

Reprints and Corporate Permissions

Please note: Selecting permissions does not provide access to the full text of the article, please see our help page How do I view content?

To request a reprint or corporate permissions for this article, please click on the relevant link below:

Academic Permissions

Please note: Selecting permissions does not provide access to the full text of the article, please see our help page How do I view content?

Obtain permissions instantly via Rightslink by clicking on the button below:

If you are unable to obtain permissions via Rightslink, please complete and submit this Permissions form. For more information, please visit our Permissions help page.