Figures & data
Figure 1. Characterization of the spontaneous and maximum release signals of nanoluciferase-expressing cells. Varying numbers of nanoluciferase-expressing Raji (A and B) or SKOV-3 (C and D) cells were incubated in triplicates for 4 h at 37°C in RPMI-1640 with 5% FBS that contained an irrelevant monoclonal Ab (trastuzumab for the Raji cells and rituximab for the SKOV-3 cells) and ADCC effector cells (E:T = 10:1), in the presence or absence of Triton X-100 to measure the maximum and spontaneous release signals, respectively, in a typical ADCC experimental setting. The nanoluciferase signal was measured as described in the Materials and Methods section. Left graphs (A and C) represent the measured spontaneous (open circles) or maximum (black squares) signals released by the different amounts of cells (mean ± SD). Linear regressions were performed for each set of data and are shown in the left graphs (dotted line for spontaneous and solid line for maximum release). For each evaluated amount of cells per well, the S/B ratio was calculated as the mean of the maximum signal divided by the mean of the spontaneous release and is shown in the right graphs (B and D).
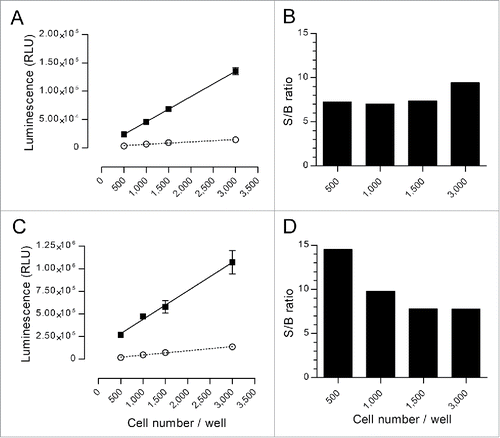
Figure 2. Correlation between cell death and nanoluciferase release. 5.0×10⁴ nanoluciferase-expressing Raji cells/well were cultured for 48 h in RPMI-1640 with 10% FBS [A] in the presence of increasing doses of the apoptosis-inducing drug staurosporine (6,4 nM to 20 µM) or [B] after increasing periods of UV exposure (10 to 60 s). In each well, the percentage of dead cells was calculated by measuring the nanoluciferase signal in the supernatant and via flow cytometry on the cell pellets, as described in the Materials and Methods section. For each tested condition in 2 independent assays, the graphs summarize the percentage of dead cells based on the nanoluciferasedetermination (x-axis) vs. the percentage of dead cells based on the flow cytometry method (y-axis). The dotted line indicates the linear regression calculated from the data. The regression equations were y = 0.97x – 2.75 (r2 = 0.9830) for staurosporine-induction (A) and y = 0.97x – 4.90 (r2 = 0.9595) for UV induction (B).
![Figure 2. Correlation between cell death and nanoluciferase release. 5.0×10⁴ nanoluciferase-expressing Raji cells/well were cultured for 48 h in RPMI-1640 with 10% FBS [A] in the presence of increasing doses of the apoptosis-inducing drug staurosporine (6,4 nM to 20 µM) or [B] after increasing periods of UV exposure (10 to 60 s). In each well, the percentage of dead cells was calculated by measuring the nanoluciferase signal in the supernatant and via flow cytometry on the cell pellets, as described in the Materials and Methods section. For each tested condition in 2 independent assays, the graphs summarize the percentage of dead cells based on the nanoluciferasedetermination (x-axis) vs. the percentage of dead cells based on the flow cytometry method (y-axis). The dotted line indicates the linear regression calculated from the data. The regression equations were y = 0.97x – 2.75 (r2 = 0.9830) for staurosporine-induction (A) and y = 0.97x – 4.90 (r2 = 0.9595) for UV induction (B).](/cms/asset/930fbcb0-6047-4453-bdc8-42653323f1fa/kmab_a_1286435_f0002_b.gif)
Figure 3. Kinetics of nanoluciferase release in ADCC and CDC assays. Nanoluciferase-expressing non-adherent Raji (A and B) or adherent SKOV-3 (C) cells were used in the ADCC (A and C) or CDC (B) assays performed during 1, 2, 3 or 4 h. At the end of the incubation, supernatants were collected, and the nanoluciferase activity was measured. The graphs indicate the percentage of the resulting specific lysis (mean of triplicates, y-axis) for each Ab concentration (Log10-transformed, x-axis) and the corresponding 4-parameter logistic regression models. The data were obtained from a single experiment, with each condition performed in triplicate.
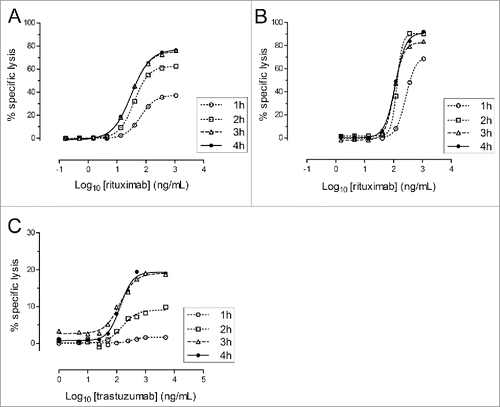
Figure 4. Nanoluciferase expression stability. The selected nanoluciferase-expressing Raji (left graph) and SKOV-3 (right graph) clones were monitored during 50 passages for nanoluciferase expression. Three thousand cells were lysed with Triton X-100, and the resulting luminescence signal was measured following substrate addition as described in the Materials and Methods section. Each dot represents an individual determination, and the median ± 40% is shown as large and small dotted lines, respectively.
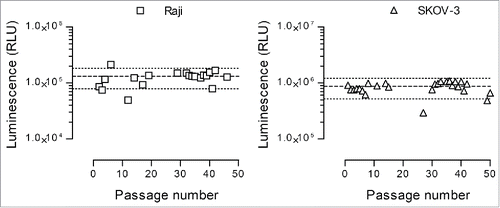
Figure 5. Direct comparison between 51Cr- and nanoluciferase-based methods. ADCC assays (A and B) were performed using nanoluciferase-expressing Raji cells (A) as a non-adherent target cell model and SKOV-3 cells (B) as an adherent target cell model. The CDC assays (C and D) were performed using nanoluciferase-expressing Raji (C) and CHO/TNF cells (D) as non-adherent and adherent target cell models, respectively. Cells were or were not labeled with 51Cr and were subsequently run in parallel in the ADCC or CDC assays. The percentages of specific lysis (y-axis) obtained in the presence of the indicated Ab concentrations (Log10-transformed, x-axis) are indicated on the graphs, with the 51Cr-release method (open squares) or the nanoluciferase-release method (black circles), together with the calculated unconstrained 4-parameter logistic regression models (dotted and solid lines, respectively). The data were obtained from 3 independent assays (mean ± SD).
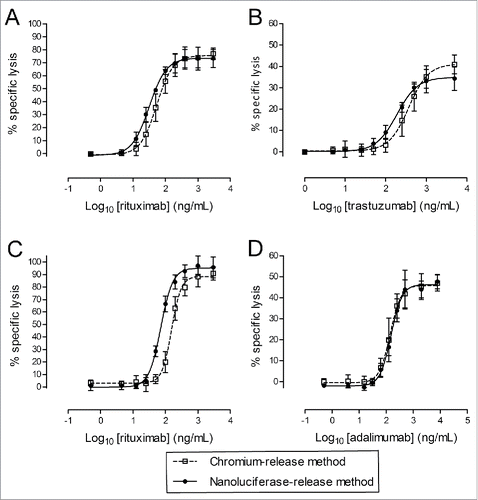
Table 1. Comparison of the characteristic parameters of ADCC and CDC assays using 51Cr and nanoluciferase methods in the unconstrained 4-parameter logistic regression model. Arithmetic mean values and ranges (minimum/maximum) of the EC50 (in ng/mL), Emin and Emax (both in % of specific lysis), as well as the coefficient of variation (CV) of the EC50 are indicated in the table for both the ADCC and CDC assays using 51Cr or nanoluciferase readouts. The data were obtained from 3 independent experiments.
Table 2. Summary of EC50 ratios and resulting biases calculated for under- (80%) and over- (125%) potent samples in the different ADCC and CDC models. The ratio between the reference and the under- or over-potent samples was calculated for each assay, and the table indicates the arithmetic mean values and CV. The biases represent the difference between the calculated and expected (0.8 and 1.25 for 80% and 125% samples, respectively) ratios. The table indicates the biases' arithmetic mean values and ranges (minimum/maximum). The data were obtained from 3 independent experiments.
Table 3. Comparison of the characteristic parameters of ADCC assays using the nanoluciferase, calcein or TR-FRET methods in the unconstrained 4-parameter logistic regression model. The EC50 (means and the corresponding CV), Emin and Emax (mean and range) from the reference sample are indicated in the table for both cellular models, using the different readouts. Correlation coefficients (r2) are also indicated to illustrate the data fitting to the regression model. The relative biases (and ranges) obtained with the under- and over-concentrated test samples (80% and 125%) are also shown. The data were obtained from 3 independent experiments (see also ). * In the Raji/calcein model @125%, only one experiment over 3 gave data fitting with the logistic model.
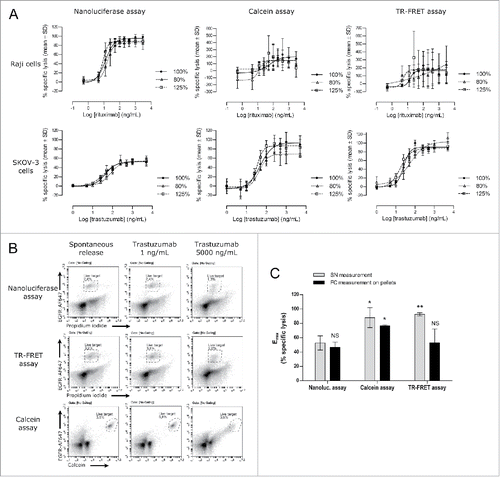
Figure 6. Direct comparison of the nanoluciferase method to the calcein and TR-FRET methods. Nanoluciferase –expressing target cells (Raji or SKOV-3) were used to measure ADCC activities either directly by nanoluciferase-release read-out or after calcein or BATDA labeling. (A) The resulting percentages of specific lysis and unconstrained 4-parameter logistic regressions are shown for the reference Ab (100%, black circle and plain line) and for the under-concentrated (80%, open triangle and short-dotted line) and over-concentrated (125%, open square and long-dotted line) test samples. The upper and lower panels show the results obtained with the Raji cells (note the wide Y-axis range variations between the different methods) and with the SKOV-3 model, respectively, using the 3 methods (nanoluciferase on the left, calcein on the center, and TR-FRET on the right). Data are the means ± SD from 3 independent experiments. (B) After supernatant harvesting for nanoluciferase, calcein and TR-FRET signal measurements, SKOV-3 cell pellets were washed and stained for measuring the percentage of remaining living target cells by flow cytometry (see the Material and methods section for the analysis details). The resulting percentages are shown on each dot plot. Only the spontaneous release and the lowest and highest antibody concentrations are depicted on the figure. Data are from one experiment representative of 2. (C) The Emax parameters (from unconstrained 4-parameter logistic regressions) obtained in each assay (nanoluciferase, calcein or TR-FRET) using both read-out, i.e., the respective supernatant (SN) read-out (light gray bars) and the flow cytometry (FC) measurement on the pellets (black bars), are shown. Data are mean ± SD from 2 (flow cytometry) or 3 (supernatant reading) experiments. Using the nanoluciferase supernatant condition as a reference, Student's t tests were performed against the other conditions and results are shown on the graph: NS, not significant (p > 0.05); * p ≤ 0.05; ** p ≤ 0.005.
