Figures & data
Figure 1. TagLite analysis of the ASGPR Ab to human and mouse ASGPR1. (A) HEK293 EBNA cells were transiently transfected with either a human or a mouse ASGPR1-SNAP tag fusion construct and the SNAP tag was labeled with Tb. A three-fold dilution series of the ASGPR Ab ranging from 100 to 0.005 nM in combination with a d2-labeled anti-human Fc antibody was incubated with the cells. After 3 hours of incubation, FRET signals were measured. Emission ratio (665 nm/620 nm) data is plotted in black (right y axis) or in grey (left y axis) for human or murine ASGPR1, respectively. Lines are the respective fitted binding curves. (B) calculated dissociation constants (Kd) and their confidence interval (CI).
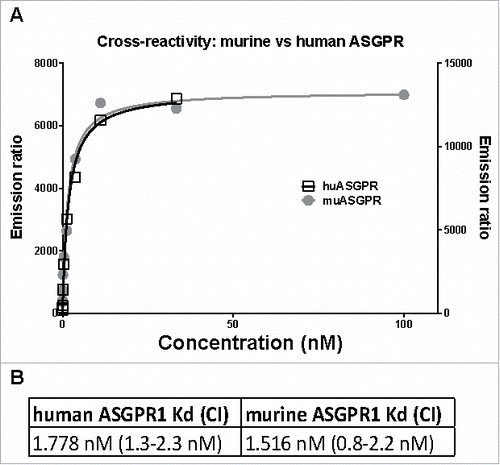
Figure 2. Individual plasma total anti-ASGPR antibody concentrations over time and model prediction in mice after IV bolus dosing. Markers present individual measurements for 1 mg/kg (◊), 5 mg/kg (•), 10 mg/kg (□) and 30 mg/kg (▴). Lines represent the developed model predicted values for the tested doses. The inset represents a detailed zoom-in of the data and predictions from 0 to 48 hours. The model parameters used for simulations are presented in .
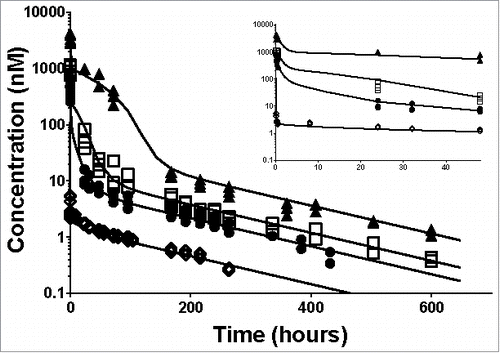
Figure 3. Schematic illustration of the target-mediated drug disposition model. The non-target related PK is represented by a two-compartment model (in grey) including linear distribution and clearance processes. The dashed compartment represents the depot compartment from which the antibodies are absorbed for simulating subcutaneous (SC) injection. The liver is represented in the central compartment where the ASGPR is expressed at the surface of the hepatocytes. The interaction of the antibodies with the receptors results in a nonlinear target-mediated elimination pathway (in red). Binding to the ASGPR leads to the complex formation and endocytosis. The receptor turn-over is also represented with a synthesis and degradation rate. All parameters used in the model are given in brackets.
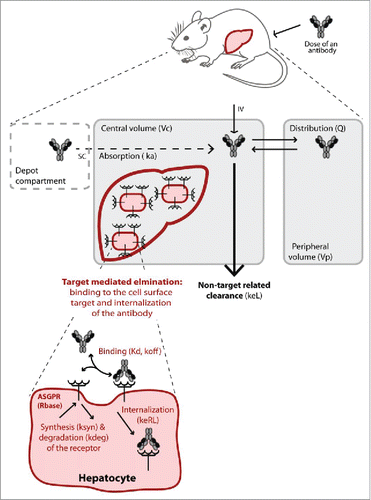
Table 1. Parameter estimates of the TMDD model after IV bolus.
Figure 4. Application of the developed TMDD model for SC dosing of the anti-ASGPR antibody. Markers present individual measurements for 1 mg/kg (◊) and 30 mg/kg (▴). Lines represent model predicted values. The model parameters used for simulations are presented in Supplementary Table 2.
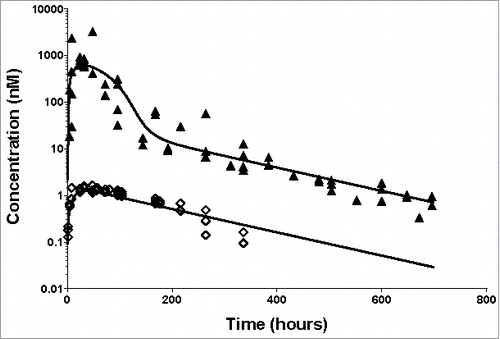
Figure 5. Distribution study (A) Percentage of injected dose in liver after an IV bolus dose of 10 mg/kg of the ASGPR Ab (grey) or the non-targeting Ab (dotted area) (B) Predicted (grey) versus observed (light grey) liver content of the ASGPR Ab.
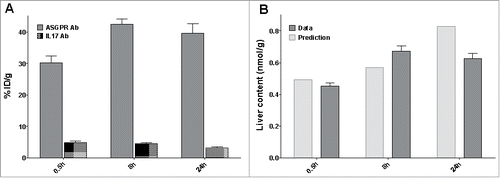
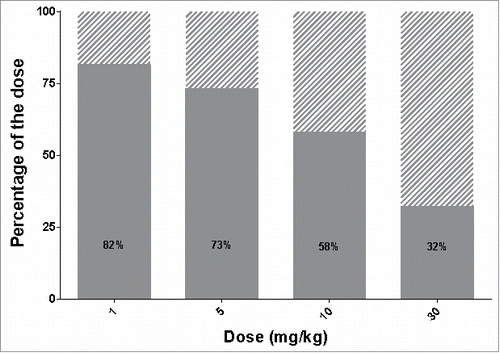
Figure 6. Optimization of protocol administration for maximizing delivery efficiency. (A) Delivery efficiency (grey), percentage of dose cleared via unspecific (non-target related) mechanisms (dashed area) or still bound to the receptor at 720 hours (30 days) post dose (black) after single IV bolus. (B) Simulated free available receptor concentrations over time in mice after IV bolus for all tested doses. The doses are indicated in mg/kg beside each simulation. (C) Delivery efficiency and (D) Quantity of the dose internalized via the target-mediated clearance pathway after two consecutive doses IV, varying the total amount and the interval between doses. The interval between the two consecutive doses is expressed in days, the dose in mg/kg and the quantity in nmol/g of liver. In both graphs, contour lines represent equivalent percentage or quantity values, respectively.
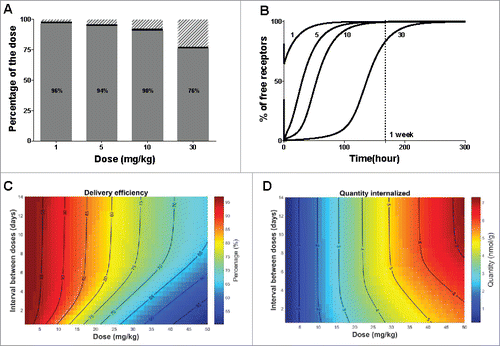
Figure 7. Influence of plasma sustainability on delivery efficiency. Delivery efficiency (grey area) and percentage of dose cleared via unspecific (non-target related) mechanisms (dashed area) in case of increased clearance rate (keL multiplied by a factor of 10).