Figures & data
Figure 1. Composition of a complex oligosaccharide attached to IgG Fc. A: The glycan is covalently linked to asparagine 297 of the heavy chain (EU numbering, according Kabat et al.Citation53). GlcNAc, N-acetylglucosamine; Man, mannose; bisec. GlcNAc, bisecting N-acetylglucosamine; Gal, galactose; Neu5Ac, N-acetyl-neuraminic acid; Fuc, fucose. β1,4 etc.: glycosidic bond. G0, G1, G2: complex type glycan comprising zero, one or two galactose residues added to the core structure. B: Comparison of wild-type and pre-glycoengineered N-glycosylation in CHO cells. High mannose N-glycans will be transferred from the ER to Golgi apparatus by vesicular trafficking. In wild-type CHO cells the Man-II processed glycans are linked with fucose to the proximal GlcNAc of the glycan core structure by alpha-(1,6)-fucosyltransferase 8 (FUT8). In pre-glycoengineered CHO cells the overexpression of Man-II and GnT-III, which is not expressed in wild-type CHO cells, leads to formation of bisecting GlcNAc glycans. By that, the transfer of fucose by FUT8 is substantially reduced by bisecting GlcNAc glycans. The resulting a-fucosylated N-glycans are more potent for inducing antibody-dependent cell-meditated cytotoxicity (ADCC) than fucosylated glycans.
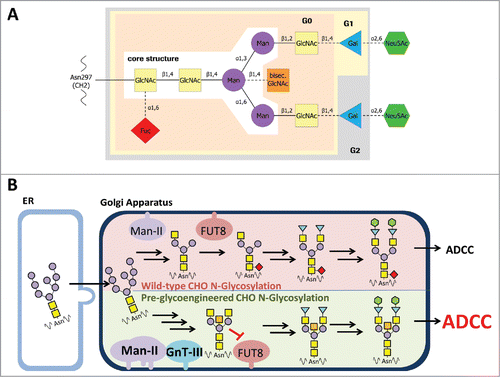
Figure 2. Antibody a-fucosylation rate in host cell lines with GnT-III/Man-II double transfection. A: A-fucosylation level after transient transfection of glycoengineered host cell lines with mAb2 expression plasmid. Antibody was purified by protein A chromatography. The a-fucose ratio was determined by MALDI-TOF MS. The bars in grey represent the one-fold glycoengineered parental host cell lines. The corresponding HCLs that were glycoengineered a second time are depicted in black. CHO-K1 cells were used as control to determine the background of non-glycoengineered HCL (white bar). Clones selected for further evaluation are marked by asterisks. B: A-fucosylation level of mAb2 expressed in clones obtained by stable transfection of two-fold glycoengineered host cell lines. Clones derived from HCLs 17–483, 17–494 and 51–201 were cultivated in 6-well plates. Clones derived from HCLs 64–30, 64–6024, 64–6123, 260–501 and 260–1513 were cultivated in 24-well plates. Antibody was purified by protein A HPLC. The a-fucose ratio was quantified by MALDI-TOF MS.
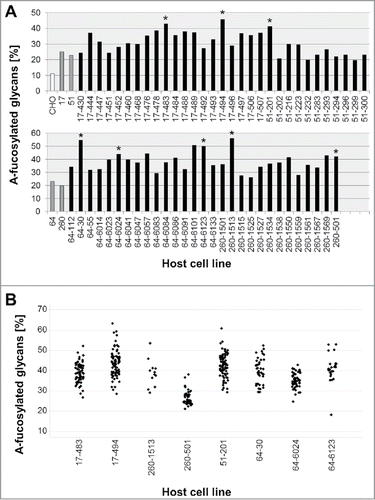
Figure 3. Overview of the development process and the lineage of the glycoengineered host cell lines. Glycoengineered HCLs were generated in a two-step strategy, starting with generating parental HCLs by stable transfection of wild-type CHO-K1 cells (highlighted by blue circle) with GnT-III and Man-II (highlighted by light orange circles). In a second step, parental HCLs were stably transfected a second time with GnT-III and Man-II (highlighted by orange circles). Generated glycoengineered CHO-K1 cell lines were subsequently used to establish stable cell lines (highlighted by green circle) for the expression of a-fucosylated mAbs. The numbers represent the clone naming as listed in .
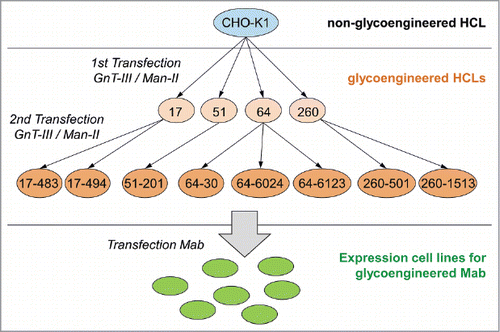
Figure 4. Comparison of glycosylation pattern of antibodies produced in pre-glycoengineered host cell lines. A: Average glycan type distribution. Eight glyco-engineered host cell lines were stably transfected with mAb2 antibody genes. On average, antibody oligosaccharide structures from 49 clones per HCL were analyzed by MALDI-TOF MS and classified into high mannose, hybrid type, non-bisected complex (WT) or bisected complex type glycans. A-fuc, sum of a-fucosylated glycans. Error bars represent standard deviation according to the number of clones tested (as listed in ). B: Stable transfection of HCL 17–494 or 64–30 with mAb3, or co-transfection with mAb3, GnT-III and Man-II (G/M). Glycan composition of 21 to 24 clones per transfection was analyzed by MALDI-TOF MS to calculate the average distribution and a-fucosylation rate. Error bars represent standard deviation according to the number of clones tested (as listed in ).
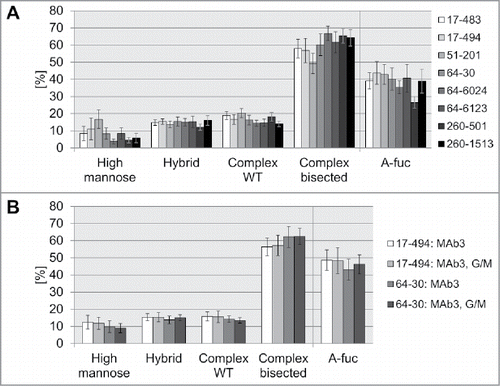
Table 1. A-fucosylation of antibody expression cell lines derived from stable transfection of glycoengineered host cell lines. The host cell lines were transfected with a standard plasmid used for development of expression cell lines for a human antibody (mAb2 or mAb3), or co-transfected with an antibody and a GnT-III/Man-II expression plasmid. The antibody plasmid also contained the DHFR gene, and methotrexate was added to the medium as selective agent. After about three weeks of clone selection, the plates were screened for antibody expression by ELISA. Antibody expressing clones were further expanded into shaken 24-well or 6-well plates to perform a batch culture with a defined cell count at start. The antibody was purified from the cell culture supernatant after 7 days by protein A HPLC. The proportion of a-fucosylated glycans was measured by RP-HPLC or MALDI-TOF MS.
Figure 5. Characterization of transgene stability. A: GnT-III expression for each HCL was determined by flow cytometry after intracellular staining. Each time point was measured in triplicates. Relative GEO Mean: Geometric mean fluorescence intensity normalized to 100% at day zero. B: Man-II expression assessment by flow cytometry as described for GnT-III (A). C: Copy number determination at day zero and after 180 days (HCL 17–494) or 134 days (HCL 60–30) by qPCR. Error bars represent standard deviation.
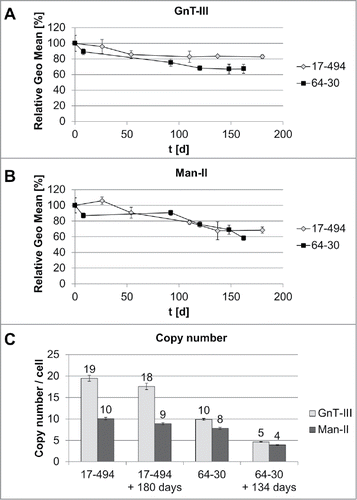
Figure 6. Comparison of MALDI TOF MS and FcγRIIIa chromatography as two different methods to analyze the a-fucosylation degree of antibodies. Batch culture samples from 69 mAb2 expressing clones derived from HCL 17–483, 73 samples from HCL 17–494 and 80 samples from HCL 51–201 were analyzed by MALDI-TOF MS to determine the percentage of a-fucosylated glycans (A-fuc). In parallel, the relative biological activity (RBA) was measured by FcγRIIIa affinity chromatography. Linear regression analysis was performed excluding two outliers (triangles).
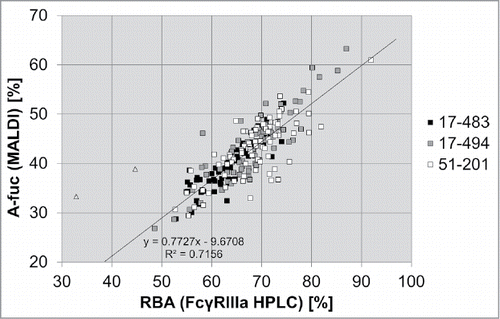
Figure 7. Influence of medium trace elements on a-fucosylation degree of antibodies. Different concentrations for manganese, copper, and iron in a chemically-defined medium A (CDM-A) were used for cultivation experiments with preglycoengineerd CHO cells all expressing the same mAb3 (A). The relative biological activity (RBA, measured by FcγRIIIa chromatography) for mAb3 produced with clone 1 in a 14-day fed-batch cultivation with CDM-A variants A1 to A8 is shown in (B). Six mAb3 expressing clones, clone 1, clone 2, clone 3 - HCL 17–494 based, clone 4, clone 5, clone 6 - HCL 64–30 (as listed in ) based were cultivated in a seven day batch process with low (A1) and high (A2) manganese levels. The RBA is shown in (C). The different glycan species of mAb3 produced with clone 1 in a 14-day fed-batch cultivation with CDM-A variants A1 to A8 are shown in (D).
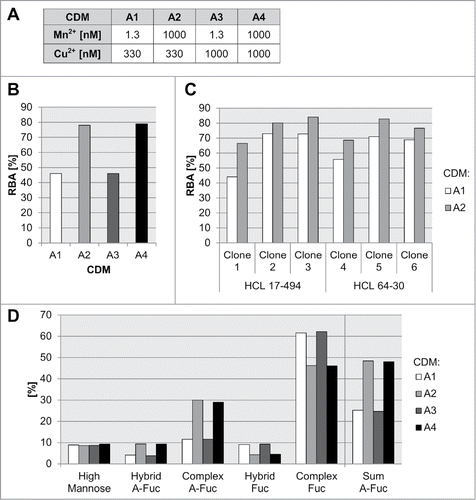
Figure 8. Influence of medium and process parameters on titer and different a-fucosylated glycan classes. A: Three mAb3 expressing clones (clone 1 to 3) were cultivated in a fed-batch process using different basal media, manganese concentrations, base media osmolality levels, and cultivation temperature. For selected tested cultivation and medium conditions the titer (B), the sum of a-fucosylated IgGs (C), sum of complex a-fucosylated IgGs (D), sum of hybrid a-fucosylated IgGs (E), and sum of high mannose IgGs (F) were analyzed. The sum of complex, hybrid and mannose species was quantified by an appropriate MS method.
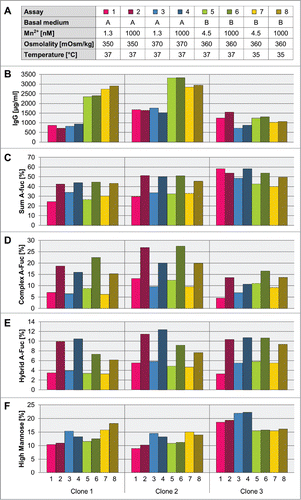
Table 2. Origin of recombinant clones used for cultivation experiments. The recombinant clones expressing a human antibody (mAb3, mAb4 or mAb5) were generated using either the wild-type CHO-K1 host cell line or glycoengineered host cell lines 17–494 or 64–30.
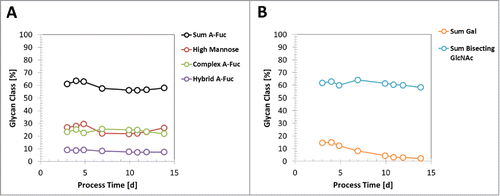
Figure 9. Dynamic of glycan species profile during a fed-batch process. A mAb3 expressing clone 5 was cultivated in a 14-day fed-batch process using media CDM-B and respective feeds. A: The glycan species abundance at different process timepoints, measured by RP-HPLC, is shown for sum of a-fucosylated (A-fuc) IgGs, sum of high mannose IgGs, sum of a-fucosylated complex-type IgGs, and sum of a-fucosylated hybrid-type IgG. B: The abundance of galactosylated IgGs and sum of GlcNAc-bisecting glycan species is shown.
