6,290
Views
5
CrossRef citations to date
0
Altmetric
Report

Productive common light chain libraries yield diverse panels of high affinity bispecific antibodies

, ORCID Icon, , , , , , , , , , ORCID Icon, , ORCID Icon, , , , , , , & show all
Pages 256-268 | Received 12 Oct 2017, Accepted 11 Nov 2017, Published online: 14 Dec 2017

Figures & data

Figure 1. Human synthetic antibody library design. (A) Amino acid usage in the library design for VH3-23 CDR-H3 length 12. Kabat numbering and germline reference amino acid are shown for each position. (B and C) Library post-translational modification (PTM) motif reduction. (B) Theoretical frequency of potentially detrimental PTM motifs in the library design for each germline before and after removal from CDR-H1 and CDR-H2. (B) Results for individual PTM motifs for CDR-H3 length 12. (C) Theoretical frequency of all PTM motifs before (x-axis) and after (y-axis) removal from CDR-H1 and CDR-H2 across all CDR-H3 lengths. Each symbol represents a different CDR-H3 length for the indicated germline and the arrow indicates how the frequencies increase with increasing CDR-H3 length.
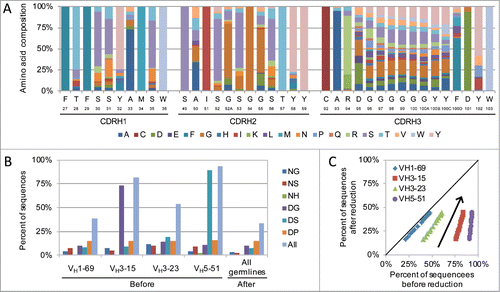
Figure 1. Human synthetic antibody library design. (A) Amino acid usage in the library design for VH3-23 CDR-H3 length 12. Kabat numbering and germline reference amino acid are shown for each position. (B and C) Library post-translational modification (PTM) motif reduction. (B) Theoretical frequency of potentially detrimental PTM motifs in the library design for each germline before and after removal from CDR-H1 and CDR-H2. (B) Results for individual PTM motifs for CDR-H3 length 12. (C) Theoretical frequency of all PTM motifs before (x-axis) and after (y-axis) removal from CDR-H1 and CDR-H2 across all CDR-H3 lengths. Each symbol represents a different CDR-H3 length for the indicated germline and the arrow indicates how the frequencies increase with increasing CDR-H3 length.

Table 1. Library panning and antibody screening summary.

Figure 2. Antibody binding and sequence analysis. (A) Antibody binding specificity ELISA. Results from 1536 antibodies isolated after the 4th and 5th round of panning toward 4-1BB. (B) Germline usage of unique antigen-specific antibodies isolated following library panning toward three different antigens. A total of 887, 601 and 1244 unique antibodies toward 4-1BB, EGFR and ROR2 were identified and included in the analysis (). (C) CDR-H3 length distribution profile of the unique antigen-specific antibodies across all three panning antigens (blue), the library design (red) and the immune repertoire from 218 human donors (green). (D) Affinities of unique and antigen-specific scFvs toward all three antigens. Antibodies were expressed as full-length IgGs and their monovalent affinities determined at 37 ˚C using SPR. (E) Epitope binning for 32 anti-ROR2 antibodies. The antibodies are grouped based on their common light chain. For each antibody pair it is indicated if they sandwich (Y), do not sandwich (N) or if the results were ambiguous (A).
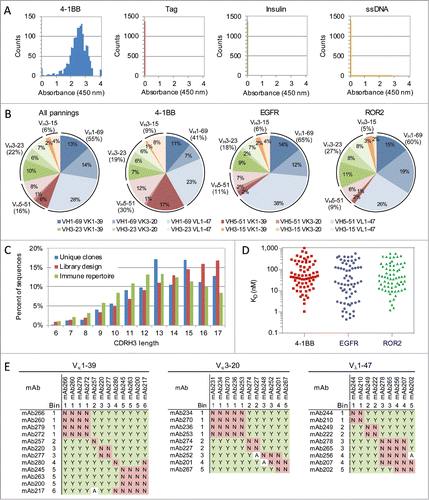
Figure 2. Antibody binding and sequence analysis. (A) Antibody binding specificity ELISA. Results from 1536 antibodies isolated after the 4th and 5th round of panning toward 4-1BB. (B) Germline usage of unique antigen-specific antibodies isolated following library panning toward three different antigens. A total of 887, 601 and 1244 unique antibodies toward 4-1BB, EGFR and ROR2 were identified and included in the analysis (Table 1). (C) CDR-H3 length distribution profile of the unique antigen-specific antibodies across all three panning antigens (blue), the library design (red) and the immune repertoire from 218 human donors (green). (D) Affinities of unique and antigen-specific scFvs toward all three antigens. Antibodies were expressed as full-length IgGs and their monovalent affinities determined at 37 ˚C using SPR. (E) Epitope binning for 32 anti-ROR2 antibodies. The antibodies are grouped based on their common light chain. For each antibody pair it is indicated if they sandwich (Y), do not sandwich (N) or if the results were ambiguous (A).

Figure 3. Higher affinity antibody generation. (A) Germline-specific primers were used to recover the CDR-H3 sequences while maintaining the VH and VL germline pairings of each clone. The resulting fragments were cloned into a Fab display phagemid containing the original germline pairings for each CDR-H3 sequence. (B) Germline usage of unique antigen-specific antibodies isolated following library panning toward 4-1BB using the original library or CDR-H3 shuffled library. A total of 748 and 135 unique CDR-H3 sequences were identified following panning the original library and CDR-H3 shuffled library, respectively, and included in the analysis. (C) Affinities of unique and antigen-specific scFvs toward 4-1BB from the original library (red) and CDR-H3 shuffled library (purple). Antibodies were expressed as full-length IgGs and their monovalent affinities determined at 37 ˚C using a biosensor. (D) Epitope binning for 32 CDR-H3 shuffled anti-4-1BB antibodies. The antibodies are grouped based on their common light chain. For each antibody pair, it is indicated if they sandwich (Y), do not sandwich (N) or if the results were ambiguous (A).
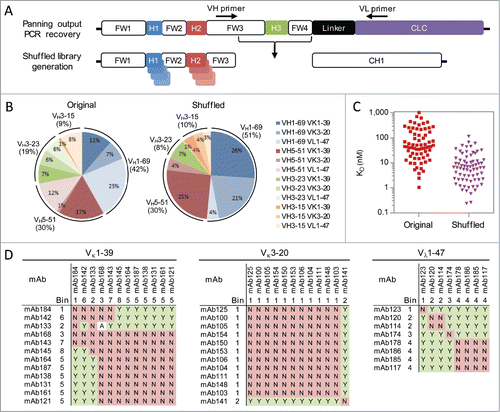
Figure 3. Higher affinity antibody generation. (A) Germline-specific primers were used to recover the CDR-H3 sequences while maintaining the VH and VL germline pairings of each clone. The resulting fragments were cloned into a Fab display phagemid containing the original germline pairings for each CDR-H3 sequence. (B) Germline usage of unique antigen-specific antibodies isolated following library panning toward 4-1BB using the original library or CDR-H3 shuffled library. A total of 748 and 135 unique CDR-H3 sequences were identified following panning the original library and CDR-H3 shuffled library, respectively, and included in the analysis. (C) Affinities of unique and antigen-specific scFvs toward 4-1BB from the original library (red) and CDR-H3 shuffled library (purple). Antibodies were expressed as full-length IgGs and their monovalent affinities determined at 37 ˚C using a biosensor. (D) Epitope binning for 32 CDR-H3 shuffled anti-4-1BB antibodies. The antibodies are grouped based on their common light chain. For each antibody pair, it is indicated if they sandwich (Y), do not sandwich (N) or if the results were ambiguous (A).

Figure 4. Universal method for BsIgG expression and purification. (A) Schematic of the method. Both heavy chains (higher pI in blue, lower pI in red) and their shared common light chain (gray) are co-expressed from a single cell. The heavy chains contain complementary mutations in their constant regions to facilitate preferentially heterodimer formation.Citation16 A polyhistidine tag was incorporated on the C-terminus of the heavy chain with the lower pI. The clarified cell culture supernatant was subjected to an automated four-step tandem purification process on an FPLC to purify the BsIgG from the monospecific contaminants. (B) Ion exchange chromatography (IEC) elution profiles of individually expressed mAb A hIgG2 EEE (red) and mAb B hIgG2 RRRR (blue), and co-expression of mAb A and mAb B (green). The linear gradient of percent buffer B (black) is also shown. The number of histidines in the polyhistidine tag on mAb B hIgG2 RRRR is indicated.
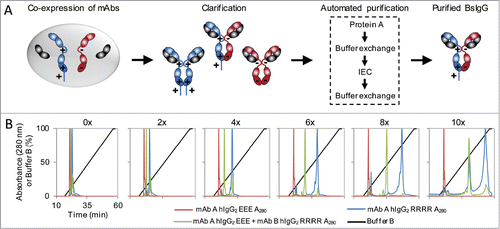
Figure 4. Universal method for BsIgG expression and purification. (A) Schematic of the method. Both heavy chains (higher pI in blue, lower pI in red) and their shared common light chain (gray) are co-expressed from a single cell. The heavy chains contain complementary mutations in their constant regions to facilitate preferentially heterodimer formation.Citation16 A polyhistidine tag was incorporated on the C-terminus of the heavy chain with the lower pI. The clarified cell culture supernatant was subjected to an automated four-step tandem purification process on an FPLC to purify the BsIgG from the monospecific contaminants. (B) Ion exchange chromatography (IEC) elution profiles of individually expressed mAb A hIgG2 EEE (red) and mAb B hIgG2 RRRR (blue), and co-expression of mAb A and mAb B (green). The linear gradient of percent buffer B (black) is also shown. The number of histidines in the polyhistidine tag on mAb B hIgG2 RRRR is indicated.

Figure 5. Antibody induced 4-1BB. Both monospecific and bispecific antibodies with a range of EC50 and maximum signaling levels were generated. The positive control is the commercially available anti-mouse 4-1BB antibody MAB9371 (red dashed) and the negative control is an antibody toward an irrelevant antigen (black dashed). The sample name includes the antibody affinity. All antibodies were generated with human IgG2dA D265A Fcs with or without the bispecific EEE or RRRR mutations. The relative luminescence units (RLU) for each antibody was normalized to the positive control included on the same assay plate. High throughput screening limited the number of replicates to an N of 1 or 2 for all antibodies with the exception of MAB9371 which had an average standard deviation of 0.06 normalized RLU over 10 replicates at each of 6 concentrations (Fig. S13).
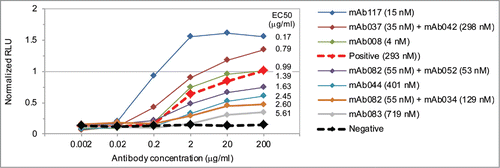
Figure 5. Antibody induced 4-1BB. Both monospecific and bispecific antibodies with a range of EC50 and maximum signaling levels were generated. The positive control is the commercially available anti-mouse 4-1BB antibody MAB9371 (red dashed) and the negative control is an antibody toward an irrelevant antigen (black dashed). The sample name includes the antibody affinity. All antibodies were generated with human IgG2dA D265A Fcs with or without the bispecific EEE or RRRR mutations. The relative luminescence units (RLU) for each antibody was normalized to the positive control included on the same assay plate. High throughput screening limited the number of replicates to an N of 1 or 2 for all antibodies with the exception of MAB9371 which had an average standard deviation of 0.06 normalized RLU over 10 replicates at each of 6 concentrations (Fig. S13).
Supplemental material

1406570_Suppl_Mat.zip

Download Zip (1.6 MB)