
Figures & data
Figure 1. Single kinetic analysis of anti-TL1A antibody C03V binding to TL1A from different species as measured using surface plasmon resonance. (RU – response units). Abbreviation: cyno = cynomolgus macaque.
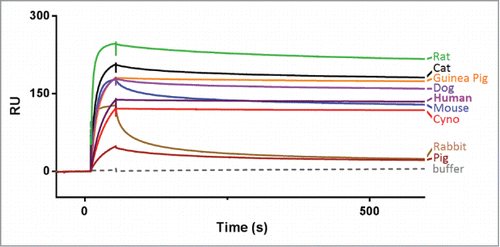
Figure 2. The affinity of C03V for human TL1A was determined using KinExA. A: C03V/TL1A KD determination with C03V as the constant binding partner (CBP). Equilibrium curves were generated with 15, 50 and 150 pM C03V. B: C03V/TL1A KD determination with TL1A as the CBP. Equilibrium curves were generated with 30, 100 and 300 pM TL1A. Table: KD values were determined using n-curve analysis of the equilibrium curves and an average KD value determined for each experiment. Five separate experiments were performed using C03V as the CBP and 3 separate experiments using TL1A as the CBP.
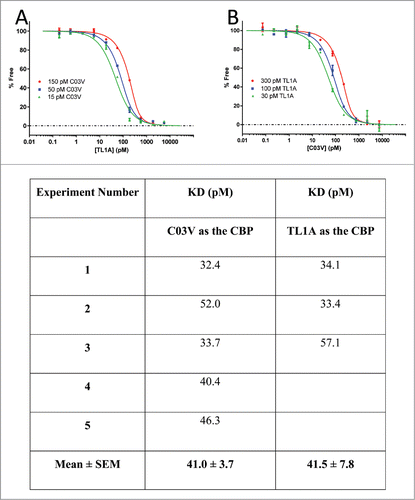
Figure 3. C03V inhibits TL1A binding to DR3 to a greater extent than to DcR3 as measured by competition ELISA (n = 3; median±range). Representative plot from three independent experiments.
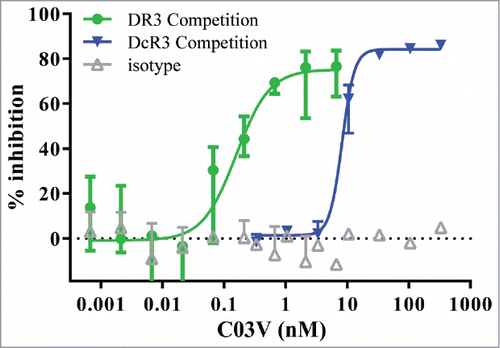
Figure 4. A) Kinetic analysis of anti-TL1A antibody C03V binding to variants of TL1A measured by SPR (duplicate runs shown) (RU – response units) B) The X-ray crystal structure of TL1A (PDB: 2RE9) showing ARG32 (R32) and ARG85 (R85) in yellow on one of the monomers in TL1A. Ribbon colors indicate secondary structure type, grey indicates other TL1A monomers in the trimeric TL1A structure; C) An ELISA measuring the binding of TL1A, TL1A-R32A and TL1A-R32A to DR3 and DcR3.
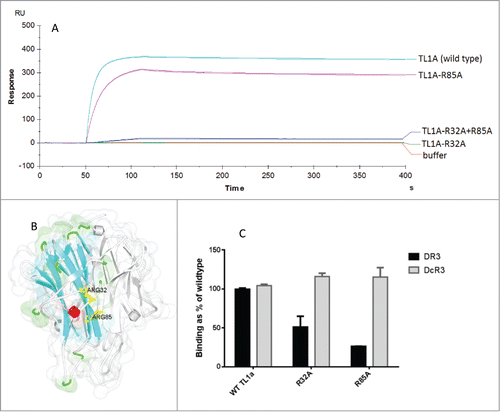
Figure 5. Recombinant human TL1A is able to induce apoptosis in cycloheximide-treated human TF-1 cells. C03V was compared to 4 other anti-TL1A antibodies (n = 8 for C03V, n = 3 for Anti-TL1A #2, Anti-TL1A #3, Anti-TL1A #4, n = 4 for Anti-TL1A #1; mean ± SD).
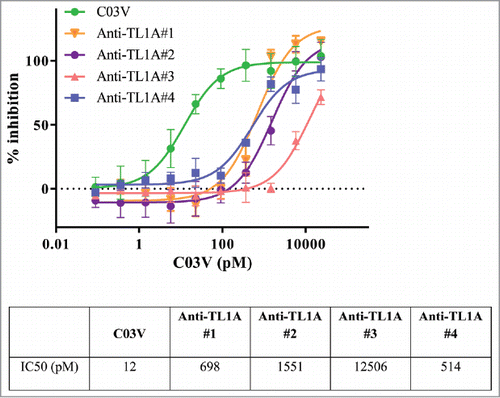
Figure 6. C03V binds to soluble and membrane-bound TL1A expressed by primary human peripheral blood mononuclear cells (PBMC). Soluble TL1A was detected by ELISA using C03V as a capture antibody. For binding experiments, C03V was conjugated to Alexa fluor® 488 and TL1A+ represents cells that bound to C03V. A) Secreted TL1A detected in cell culture supernatants of human PBMCs stimulated with immune complexes (n = 3 donors, mean + SEM). (B) Representative histogram of C03V binding (solid line) and isotype control (broken line) to membrane-bound TL1A on peripheral blood mononuclear cells isolated from human donors. Cells were analysed by gating for single, live cells (n = 3 donors corresponding to donors from (A)).
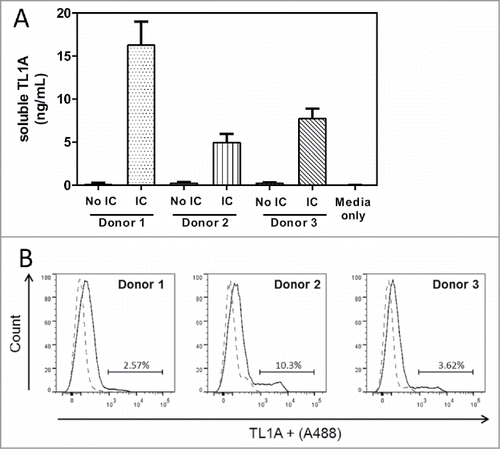
Figure 7. Blood samples from four human donors were analyzed for C03V inhibition of TL1A induced IFNγ production. Graph: C03V dose response curves were generated by plotting concentrations of IFNγ in pg/mL against the log of antibody concentrations. An isotype control antibody failed to inhibit IFNγ production more than 50% across the concentration range tested (2 technical replicates per donor, graph is representative of four donors). Table: C03V demonstrated a dose-dependent inhibition of IFN-γ production with IC50 values in the range of 0.054–0.165 nM.
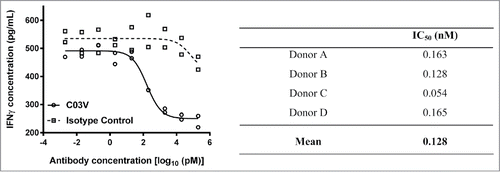
Figure 8. (A) Non-transfected EXPI293F cells did not show any induction of ADCC when treated with C03V or rituximab; (B) CO3V did not induce ADCC on cells co-transfected with TL1A and CD20 at any tested concentration but rituximab did induce ADCC activity on co-transfected EXPI239F cells. These results are representative of 3 independent experiments.
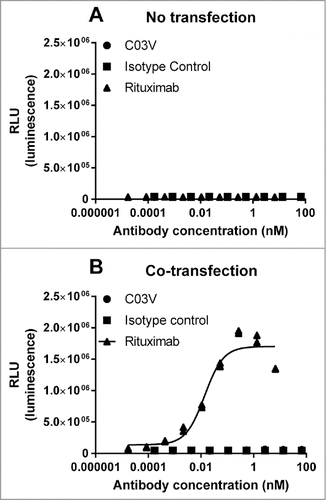
Figure 9. Macroscopic (A-D) and microscopic (E-F) assessment of colons from TNBS-induced colitis rats 7 days after a single TNBS instillation. Rats exhibited significant colon thickening at site of instillation, with stricturing and multiple adhesions. Microscopically, extensive inflammation and intermediate fibrosis are seen. Treatment with C03V significantly ameliorated these disease parameters compared with either vehicle or isotype control. (• naïve; ▪ vehicle;; ♦ isotype; ▴ C03V plotted as individual replicates with mean±S.E.M indicated. P<0.05 taken as statistically significant. Kruskall-Wallis test; n = 8).
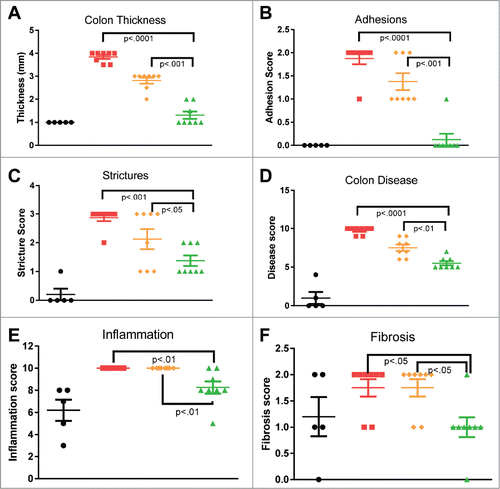
Figure 10. Ongoing colonic fibrosis and epithelial erosion is induced by a single instillation of DNBS. A. Fibrosis scoring at 7 and 14 days post-DNBS. The only significant effect was observed in the C03V treatment group which had reduced fibrosis after 14 days (compared to 7 days). (student's t-test; n = 8). B. Representative photomicrographs of Masson's trichrome staining of colon sections from ulcer (DNBS instillation) area. Vehicle and isotype control-treated rats had comparable degrees of epithelial erosion, inflammatory foci (arrows) and mild-moderate fibrosis (arrowheads) at both 7 and 14 days post-DNBS. In contrast, C03V = treated rats had significantly reduced fibrosis and restored epithelial architecture at 14 days.
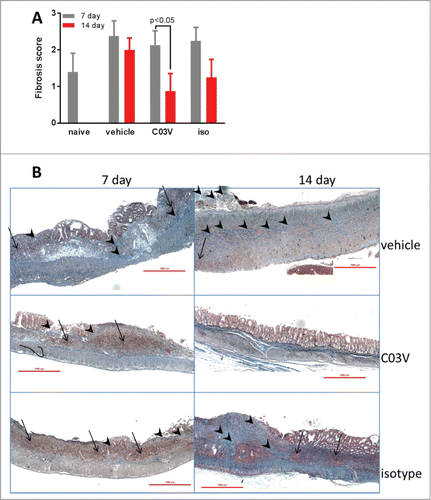
Figure 11. Assessment of BALF total cells (A) and eosinophils (B), and interstitial fibrosis by Masson's trichrome staining (C). Treatment with C03V significantly reduced induction of total cells (p<0.01) and eosinophils (p<0.001) in BALF (Kruskall-Wallis test; n = 8), and abrogated the very mild induction of fibrosis. (• naïve; ▪ vehicle; ▴ C03V; ♦ isotype).
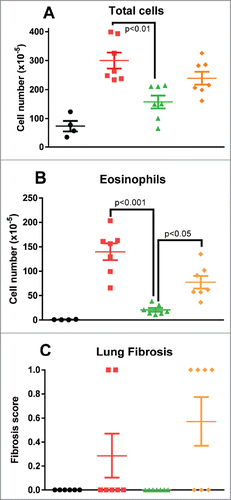
Table 1. Scoring assessment scale used in the histopathological analysis for the TNBS/DNBS studies.