
Figures & data
Figure 1. Cytokine response to IgG1 antibodies with CRS-inducing potential in preclinical whole blood assay. Heat map representation of statistically significant increase of cytokines from whole blood stimulated for 24 h with (A) anti-CD52, mAb1, (B) mAb2, or mAb3. PBS buffer was used as negative control for donor baseline cytokine levels. The response of 10 cytokines was measured by multiplex cytokine analysis. P-values generated by one-way ANOVA followed by paired T-test of log 10 transformed concentrations of treated versus untreated samples. Significant response is only considered if the geometric mean of the fold change to the relative untreated sample is ≥ 2. Donor responses shown are n = 11 (A) and n = 12 (B).
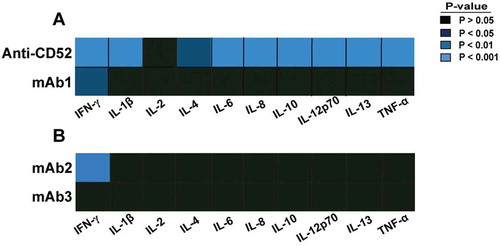
Table 1. Cytokine release profile of CRS-inducing IgG1 antibodies.
Figure 2. Magnitude of cytokine responses to IgG1 antibodies with CRS-inducing potential in preclinical whole blood assay. IFN-γ response was assessed with multiplex cytokine analysis after 24 h stimulation with (A) anti-CD52 or mAb1, (B) mAb2 or mAb3. PBS buffer was used as negative control for donor baseline cytokine levels. All IgG1 monoclonal antibodies were analyzed at 100 µg/ml except anti-CD52, which was analyzed at 10 µg/ml. Donor responses shown are n = 11 (A) and n = 12 (B). Median of donor responses is donated by horizontal bar. P-values generated by one-way ANOVA followed by paired T-test of log 10 transformed concentrations of treated versus untreated samples, (*p < 0.05, **p < 0.01, ***p < 0.001).
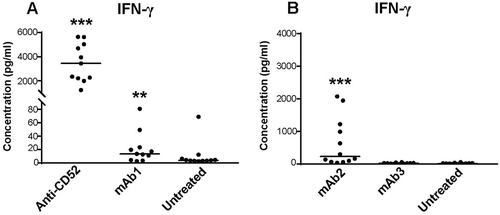
Figure 3. Kinetics of cytokine secretion to IgG1 antibodies with CRS-inducing potential. Whole blood from 4–5 donors were stimulated with anti-CD52, mAb1, mAb2 or mAb3 for 2, 4, 6, or 24 h. (A) IFN-γ, (B) TNF, and (C) IL-6 responses were assessed by multiplex cytokine analysis. Bar graph represent the mean ± SEM fold-change in cytokine levels normalized to the untreated samples. P-values generated by one-way ANOVA followed by paired T-test of log 10 transformed concentrations of treated versus untreated samples, (*p < 0.05). One representative experiment out of 2–3 experiments is shown.
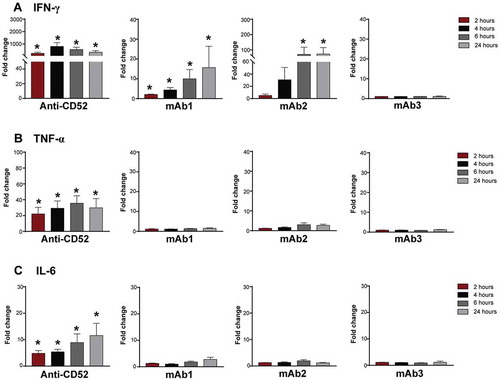
Figure 4. Impact of IgG1 antibodies with CRS-inducing potential on NK cells in preclinical whole blood assay. Human whole blood were incubated with anti-CD52, mAb1, mAb2, or mAb3 for 24 h. (A-D) IFN-γ production by NK cells (CD3-CD56+) and (B) NKT cells (CD3+ CD56+) and T cells (CD3+ CD56-) in response to (A,B) anti-CD52, (C,D) mAb1, mAb2 and mAb3. (E-H) Analysis of CD16 expression on NK cells upon stimulation with (E,F) anti-CD52, (G,H) mAb1 and mAb2, or (E-H) mAb3. Bars are presented as mean ± SEM.
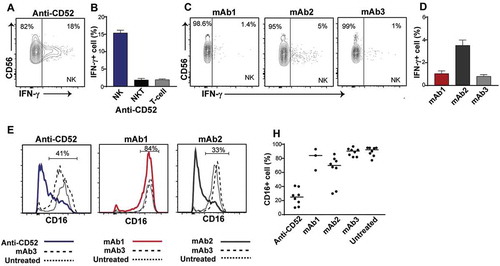
Figure 5. Importance of TNF for IFN-γ release in response to IgG1 antibodies with CRS-inducing potential. IFN-γ release expressed in pg/ml was assessed using human whole blood pre-incubated with or without anti-TNF (infliximab) and then stimulated for 24 h with (A) anti-CD52, (B) mAb2, or (C) IgG1 isotype control. (D) IFN-γ release levels from untreated or infliximab treated whole blood. Significant results are denoted by asterisks. P-values generated by one-way ANOVA followed by paired T-test of concentrations of blocked versus control samples, (*p < 0.05). Donor responses shown are n = 7.
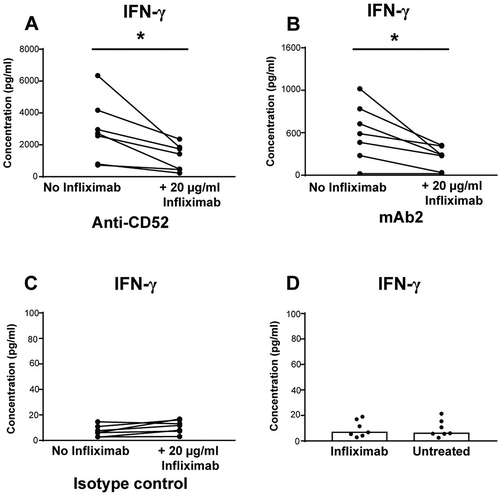
Figure 6. Importance of FcγRIII for IFN-γ release in response to IgG1 antibodies with CRS-inducing potential. (A-C) IFN-γ release was assessed using human whole blood stimulated for 24 h with (A) anti-CD52, either full-length IgG1 or F(ab’)2, (B) mAb1 with either an IgG1 or an IgG1 effector-null backbone (C) mAb2 with either an IgG1 or an IgG4 backbone. Bar graph represent the mean ± SEM fold-change in cytokine levels normalized to the untreated samples. (D,E) IFN-γ release was assessed using human whole blood pre-incubated with blocking anti-FcγR F(ab’)2 (FcγRI, FcγRII, or FcγRIII) and then stimulated for 24 h with (D) anti-CD52 or without anti-CD52 (E). P-values generated by one-way ANOVA followed by paired T-test of concentrations of blocked versus control samples (*p < 0.05, **p < 0.01, ***p < 0.001). Bars are represented as mean ± SEM. Donor responses shown are (A) n = 4, (B-D) n = 6. One representative experiment out of 2–3 experiments is shown.
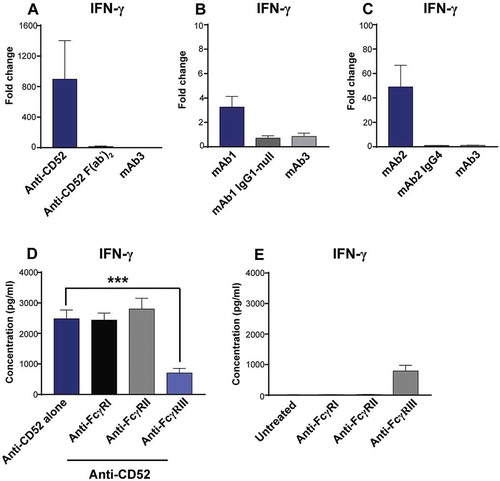
Figure 7. FcγRIIIa polymorphisms determine the magnitude of IgG1-dependent IFN-γ secretion. (A,B) 73 donors were grouped by FcγRIIIa polymorphisms: (n = 26 V/F, 19 V/V, 28 F/F). IFN-γ release was assessed using FcγRIIIa-158 genotyped human whole blood stimulated for 24 h with anti-CD52. (C,D) 19 donors were grouped by FcγRIIIa polymorphisms: (n = 6 V/F, 6 V/V, 7 F/F). IFN-γ release was assessed using FcγRIIIA-158 genotyped human whole blood stimulated for 24 h with mAb1. (E,F) 25 donors were grouped by FcγRIIIa polymorphisms (n = 9 V/F, 9 V/V, 7 F/F). IFN-γ release was assessed using FcγRIIIa-158 genotyped human whole blood stimulated for 24 h with mAb2. The median of IFN-γ response for each genotype is denoted by a horizontal bar. (B,D,F) Median and range of IFN-γ response based on FcγRIIIa polymorphisms.
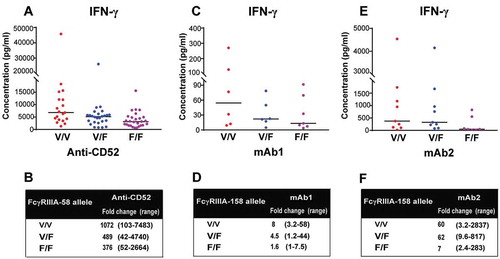
Table 2. Primer set used to identify FcγRIIIa 158 V/F alleles.