Figures & data
Table 1. Structural analysis of HC Asn325 from IgG1 and IgG4 Fc structural models in the PDB.
Table 2. Structural analysis of Asn deamidation in the Fc region.
Figure 1. Mechanism of Asparagine (Asn) Deamidation. Schematic representation of L-Asn deamidation, which can occur spontaneously by nucleophilic attack of the C-terminal adjacent peptide bond nitrogen atom on the side chain carbonyl group of L-Asn. This step leads to the formation of a tetrahedral intermediate, which quickly generates cyclic imide intermediate (succinimide). In the second step, succinimide undergoes hydrolytic attack at both carbonyl centers, leading to formation of Asp and isoAsp isoforms. The rate determining step for the deamidation process is the cyclization step leading to the succinimide intermediate, which is regulated by dihedral angles (Ψ and Χ1) and Cγ-N distance.
Figure 2. Kinetic profiles for Asn deamidation under stressed conditions. The symbols are experimental data points and the lines represent the data fitting with exponential kinetic models described in the methods. K (observed deamidation constant) was obtained from the model fitting.
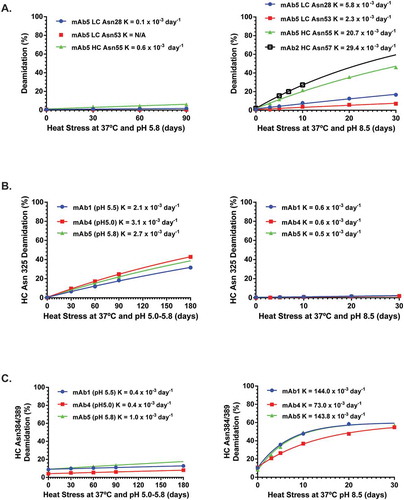
Table 3. Structural analysis of Asn deamidation in the Fv region.
Figure 3. Comparison of for HC Asn384 (A) and HC Asn389 (B) Conformations obtained from two different crystal structure models.
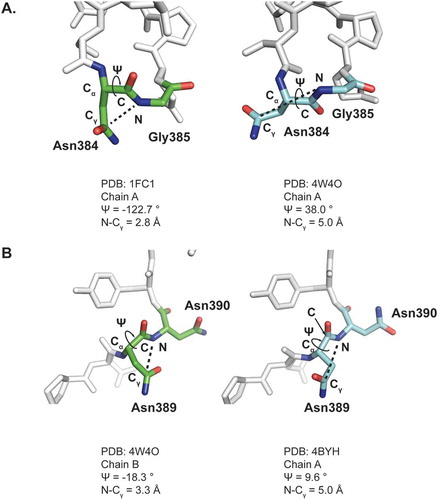
Figure 4. pH induced conformational changes around HC Asn325 in the CH2 domain of an IgG. A) Ribbon diagram representation of the HC Asn325 structure environment (PDB: 4BYH). The hydrogen bonds are shown as yellow dashed lines. B) Plots of solvent accessible surface area (SASA) as a function of pH value. Each point represents a crystal structure model from the PDB. C) Overlay of the CH2 domains from 2DTS and 4BYH. D) Surface representation of the CH2 domains from 2DTS and 4BYH showing the SASA of HC Asn325. The sidechain N and O atoms of HC Asn325 were colored blue and the rest of the CH2 domains atoms were colored grey. Only solvent exposed sidechain N and O atoms were seen in the surface representations.
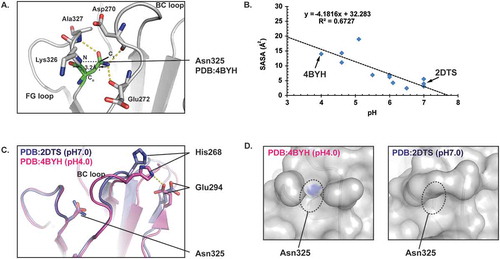
Figure 5. Comparison of Asn deamidation between IgG1 and IgG4 mAbs. A) Deamidation rate constants of Asn325 (left) and Asn384/389 (right) from five IgG4 and three IgG1 mAbs under heat stress and acidic formulation buffer storage conditions. B) Ribbon diagram representation of the crystal structure models of IgG1 and IgG4 CH2 domains. IgG1 (PDB 4BYH) and IgG4 (PDB 4C54) structures are colored by white and dark grey, respectively. A structure alignment of IgG1 and IgG4 CH2 domains is shown on the left panel. Positions of BC loops and FG loops in IgG1 and IgG4 structure models are highlighted. The right panel are zoomed-in view of Asn325 conformations in IgG1 and IgG4. The Cγ-N distances of Asn325 in IgG1 and IgG4 structure models are highlighted.
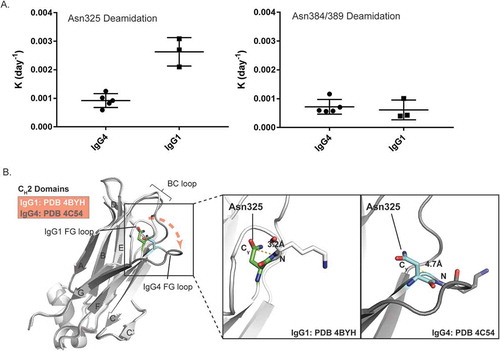
Figure 6. Decision tree for predicting Asn deamidation hot spots. Three structure parameters, β-sheet structure, Cγ-N distance and SASA were used to assign Asn residues into 4 groups with increased deamidation propensities.
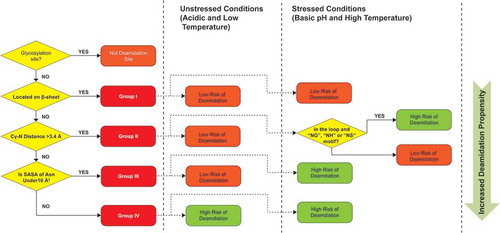
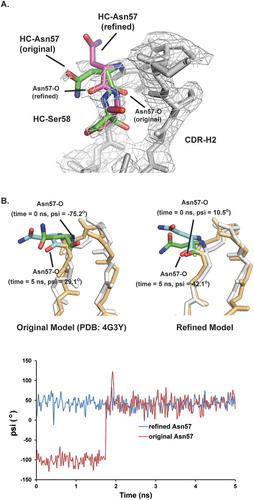
Figure 7. Structural models for HC Asn57. The conformation of HC Asn57 from original crystal structure model (PDB: 4G3Y) is not energetically favorable. A) Structure overlays of CDR-H2 loops between the original crystal structure model and refined model. The electron density map (2Fo-Fc) was shown as grey mesh at a contour level of 1σ. B) Upper panel, overlays of instantaneous structures of CDR-H2 loops at 5 ns from molecular dynamic trajectories obtained. (Left) original model (Right) refined model. Lower panel, psi angels for Asn57 during the MD simulations for both original and refined structure models.