Figures & data
Figure 1. Schematic description of the molecular structure of MBS301 and MBS301 + F.
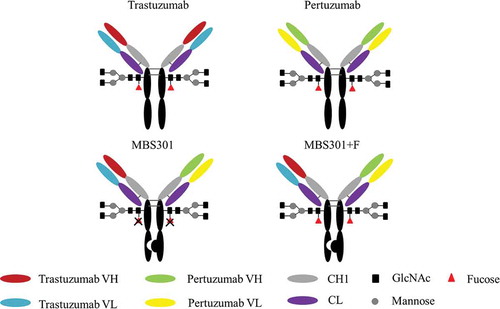
Figure 2. Schematic description of the manufacturing process of MBS301.
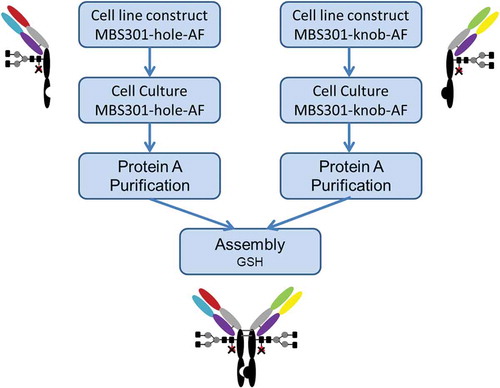
Figure 3. Analytical characterization of MBS301. (a). Intact mass analysis of deglycosylated MBS301; (b). HILIC analysis of the PNGase F enzymatically released N-glycans from MBS301 + F and MBS301, respectively; (c). Hydrophobic-interaction chromatography analysis of MBS301, MBS301-hole and MBS301-knob, respectively; (d). DSC comparative analysis of MBS301, T-mab, and P-mab, respectively, in the same formulation buffer.
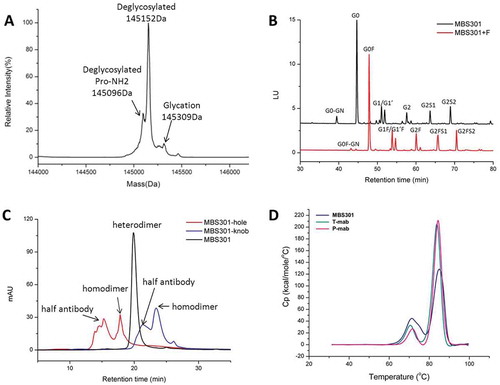
Table 1. The affinities of anti-HER2 antibodies binding to human HER2-ECD.
Figure 4. Biacore binding kinetic study of MBS301 to HER2 in competition with T-mab, P-mab, respectively. (a). 10 μg/ml T-mab was followed by co-injection of HER2-ECD-His on CM5 Chip, then followed by serially diluted MBS301. (b). 10 μg/ml MBS301 was followed by co-injection of HER2-ECD-His on CM5 Chip, then followed by serially diluted T-mab. (c). 10 μg/ml P-mab was followed by co-injection of HER2-ECD-His on CM5 Chip, then followed by serially diluted MBS301. (d). 10 μg/ml MBS301 was followed by co-injection of HER2-ECD-His on CM5 Chip, then followed by serially diluted P-mab.
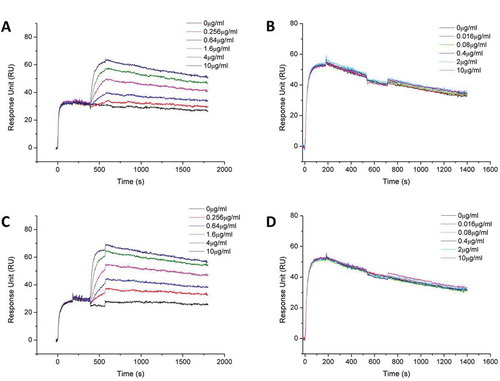
Figure 5. Computer modeling of MBS301 and the simultaneous binding of its two arms to human HER2 II and IV domains. The blue ribbon denoted HER2 II domain, and the olive green ribbon denoted HER2 IV domain, the pink ribbon denoted VH and VL of the MBS301-hole arm, and the red ribbon denoted VH and VL of MBS301-knob arm, the yellow ribbon denoted CH1 and CL of MBS301. Other parts were constructed and modeled but not displayed.
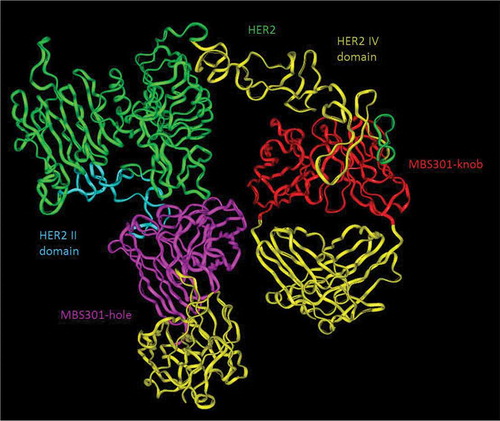
Figure 6. In vitro tumor cell proliferation inhibition evaluation. (a,b,c,d,e). Tumor cell proliferation inhibition by treating with the anti-HER2 antibodies T-mab, P-mab, combination of T-mab and P-mab (T-mab + P-mab), and MBS301, respectively, at a series of diluted concentrations from 100 to 0.0015 μg/ml on HER2+ cells BT474, MDA-MB-175VII, NCI-N87, SK-BR-3 and HCC1419. (F). The inhibition rates of the anti-HER2 antibodies on different HER2+ cancer cell lines that were calculated at the highest concentration of 100 μg/ml when a steady plateau was reached for each assay. *P < 0.0001 by one-way ANOVA analyses for the inhibition rate difference for the three cancer cell lines.
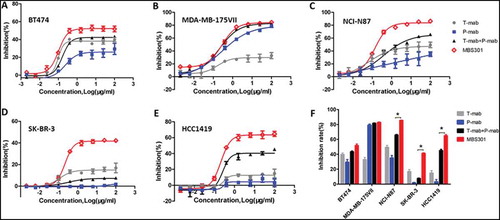
Table 2. The affinities of anti-HER2 antibodies binding to human FcγRIIIa allotypes.
Table 3. ADCC activity evaluation of anti-HER2 antibodies on four target cancer cells.
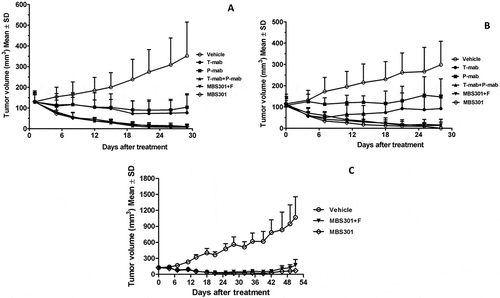
Figure 7. The in vivo therapeutic effect of MBS301 in comparison with other anti-HER2 mAb formats on different mouse xenograft models. (a) Mice with breast cancer BT-474 xenograft tumors were treated for four weeks with high dosage (13.5 mg/kg), vehicle normal saline, T-mab, P-mab, MBS301 + F, MBS301, combination of T-mab and P-mab (6.75 mg/kg each), respectively (n = 6 mice/group); (b) Mice with NCI-N87 xenograft tumors were treated for four weeks with high dosage (20 mg/kg), vehicle normal saline, T-mab, P-mab, MBS301 + F, MBS301, combination of T-mab and P-mab (10 mg/kg each), respectively (n = 6 mice/group); (c) The therapeutic effect of MBS301 in gastric cancer (NCI-N87) xenograft model in NSG-CD34 mice. Mice were treated 18 days of the study with high dosage (13.5 mg/kg), then the animals were monitored for tumor recurrence; vehicle normal saline, MBS301 + F, MBS301. (n = 6 mice/group).