Figures & data
Figure 1. (a) Design and format of the GUCY2C T-BsAb. (A) Schematic of individual chains. For the GUCY2C T-BsAb, we applied the diabody Fc format. Heterodimerization is driven using knobs-into-holes. The Fc-knob (containing Y349C and T366W, numbered according to the EU index) and Fc-hole (containing S354C, T366S, L368A, and Y407V) are derived from human IgG1Citation26,Citation27 and contain mutations L234A, L235A, and G237A in the lower hinge to reduce Fcγ receptor binding, antibody-dependent cell-mediated cytotoxicity and complement-dependent cytotoxicity.Citation28–30 EFN = effector function null. (b) Schematic of paired domains. (c) High-throughput anti-GUCY2C x anti-CD3 bispecific discovery workflow. To support bispecific discovery efforts for the GUCY2C T-BsAb program, automated reformatting, production and screening tools were implemented. This allows for parallel discovery and optimization activities where hundreds-to-thousands of hits can be cloned, produced and characterized in a very short time frame. Multiple formats were used to test for improvement of specific characteristics during optimization. This allows for rapid triaging and lead selection for scale-up as the final bispecific
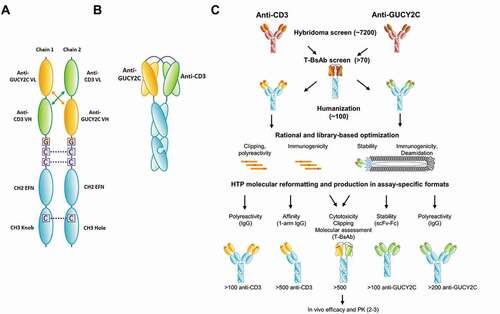
Figure 2. Rational optimization of anti-CD3 H2B4 to reduce polyreactivity and clipping. (a) Rational IgG variants with retained binding demonstrated lower polyreactivity (DNA score) compared to the parental 2B5 while maintaining desired affinity as measured by Biacore. (b) Re-humanization to H2B5 as T-BsAb with a stable control binding arm minimized clipping compared to H2B4, while H2B5v6 showed further clipping reduction as measured by cGE. Red arrows indicate clipped species. (c) H2B5v6 T-BsAb demonstrated reduced but acceptable in vitro CTL activity compared to re-humanized H2B5
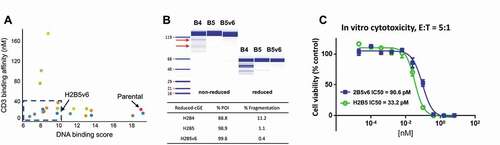
Figure 3. Characterization of chimeric GUCY2C T-BsAbs. (a) Top chimeric GUCY2C T-BsAb demonstrating CTL activity were scaled up and CTL activity against T84 tumor cells was repeated. These chimeric T-BsAbs were also analyzed for stability by DSC (b) and polyreactivity in both bispecific T-BsAb and monospecific anti-GUCY2C IgG format (c), as well as for binding to human CD3 and human GUCY2C recombinant protein by surface plasmon resonance (d)
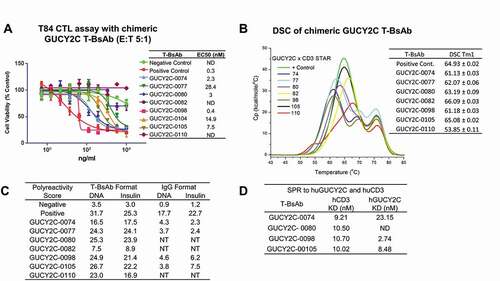
Figure 4. Soft randomization of CDRs coupled with CDR shuffling by phage display improves stability. (a) Phage display was performed on soft-randomization libraries targeting individual CDRs and the VH-VL interface of GUCY2C-0247. Thermal challenge was employed at 60°C and 65°C along with deselection using polyreactivity reagents. Output pools were recombined, creating a CDR shuffling library and additional phage selections were performed with increasing thermal challenge to 75°C to further improve stability. (b) Schematic illustration of the shuffling process to recombine CDRs from hits in the first 8-library selection
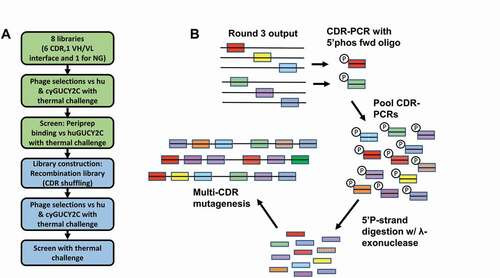
Figure 5. (a and b) Thermal challenge DELFIA assay demonstrates clones with improved thermal stability following phage display optimization. Cook-and-bind DELFIA time resolved fluorescence (TRF) measuring binding to human GUCY2C protein at 60°C, and 65°C, (X-axis) were compared with normal binding with no thermal challenge (Y-axis). Clones from individual CDR soft-randomization libraries are shown in green. Clones from CDR shuffling are shown in blue. The parental clone is shown in red. (c) ScFv-Fc binding activity following incubation at a range of temperatures, from which a T50 can be derived. Parental clone GUCY2C-0295 as scFv-Fc is shown in red and other representative clones with a range of T50 values are shown in orange, purple, blue and green. (d) DSC profiles show a spectrum of unfolding over a range of temperatures, from which a Tm1 can be derived. Representative clones are highlighted with the same coloring. (e) Correlation between T50 and Tm1 using a linear regression model
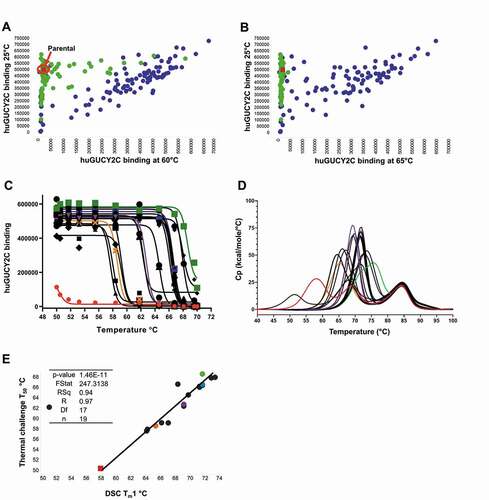
Figure 6. Optimization for manufacturability, efficacy and predicted immunogenicity. (a) CTL cytotoxicity assay (T84 cells, 48 hr, 5:1 E:T) demonstrates potent killing activity of PF-07062119 as compared to the parental GUCY2C-0247. (b) PF-07062119 demonstrates substantially reduced self-association potential and polyreactivity compared with GUCY2C-0247, as measured by AC-SINS and DNA binding assays. (c) Thermal stability in the T-BsAb demonstrated an increase in Tm1 of over 8°C compared to the parental molecule. (d) Clipped species in the parental anti-CD3 antibody H2B4 indicated by arrows (blue curve) were successfully removed in H2B5v6 (red curve) as demonstrated by cGE. (e) Long term stability analysis demonstrated good stability and no increase in HMMS for over 6 weeks at 4°C or at 25°C. (f) PF-07062119 also demonstrated low viscosity at concentrations over 100 mg/mL. Limit of 20 cP indicated by dashed red line. (g) Crystal structure of PF-07062119 (side view) shows the anti-GUCY2C domain in yellow and orange, the anti-CD3 in light and dark green, the linker sequences in blue, the stabilizing mutations in red, the immunogenicity-reducing mutations in pink, the deamidation mutation in bright green, and the disulfide constrained C-terminal domain (at bottom) also in blue. (h) Top view of tightly packed diabody structure. (i) Zoomed in view of GUCY2C VH-VL interface highlighting key stabilizing mutations with same coloring pattern of domains and mutations. Mutations at positions L94 (Ala) and H60 (His) were observed in most stability optimized clones. These mutations appear to help stabilize the VH-VL interface
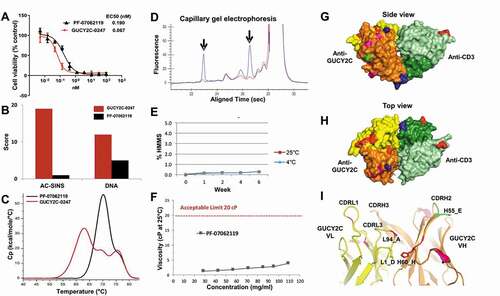
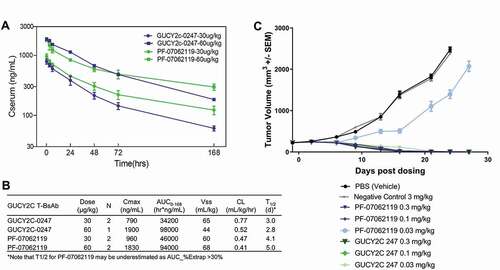
Figure 7. In vivo efficacy and PK of PF-07062119. (a) Mean serum pharmacokinetic profiles of GUCY2C-0247, PF‑06929607 and PF-07062119 in cynomolgus monkeys following single dose IV administration at 30 µg/kg and 60 µg/kg. (b) Results of non-compartmental analysis of the observed PK (0–168 hrs) of GUCY2C-0247 and PF‑07062119. Note that apparent CL estimates may be overestimated, and half-life may be underestimated for PF‑07062119 due to the limited observation period. (c) In vivo efficacy LS1034 adoptive transfer xenograft model demonstrates potent activity down to 0.1 mg/kg for PF-07062119 (n = 10 animals/group). Data shown from one donor. Similar results were obtained from separate experiments with other donor T cells