Figures & data
Table 1. Characteristics of FDA-approved anti-human PD-1, PD-L1, and CTLA-4 mAbs
Table 2. Apparent binding EC50s of anti-human or anti-mouse PD-L1 and CTLA-4 mAbs to target-expressing cells
Table 3. Binding affinities of anti-mouse and anti-human PD-L1 and CTLA-4 mAbs to recombinant protein
Table 4. Reporter bioassay data, ADCC, and ADCP activity of anti-human PD-L1 and CTLA-4 mAbs
Figure 1. Characterization of antibodies identified from a hybridoma screen in biochemical competition and cell binding assays. Hybridoma clone testing in the (a) mouse PD-L1–mouse CD80, (b) mouse PD-L1–mouse PD-1, and (c) mouse PD-L1–mAb 10 F.9G2 competition assays. (d) Of the inhibitory antibodies, 85 bound mouse PD-L1–positive Renca cells by flow cytometry with geomean fluorescence above the negative control. The dotted lines represent geomean fluorescence binding for the rat IgG2b control antibody (lower panel) and the 10 F.9G2-positive control mAb tested at 20 µg/mL (upper panel). The four IgGs denoted by red triangles (clones 17, 37, 56, and 58) were subcloned into recombinant expression vectors and were expressed and purified for further characterization in vivo. (e) Amino acid sequences of the VH and VL regions of these four clones. Statistical P values indicate one-way analysis of variance with the Dunnet posttest. FW, framework
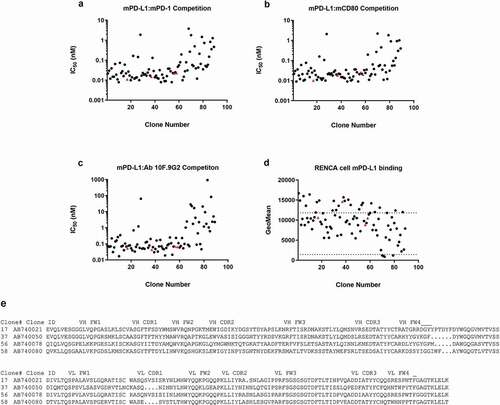
Table 5. PK parameters from the single-dose study*
Figure 2. PK profiling of mAbs. In vivo PK profiles from (a) a single-dose study and (b) a multiple-dose study of anti-mouse PD-L1 clone 80 mIgG1 D265A, anti-mouse PD-L1 clone 10 F.9G2, and anti-mouse mIgG1 CTLA-4. Measured serum mAb concentrations are indicated on the y-axis
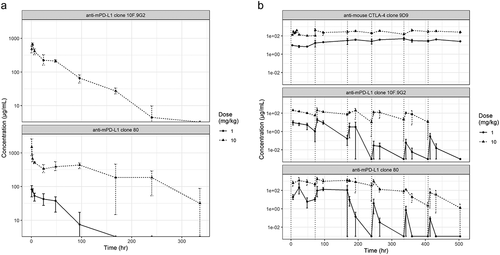
Figure 2. (Continued)
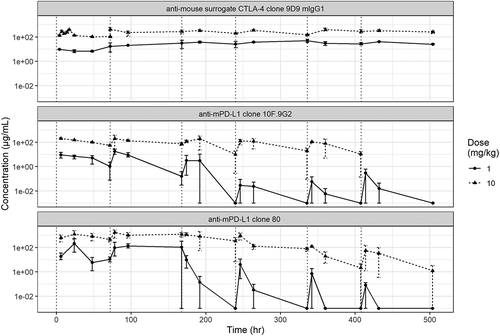
Table 6. PK parameters from the multiple-dose study*
Table 7. Complete response rate of anti-mouse PD-L1 clone 80 and anti-mouse CTLA-4 mAbs across eight mouse syngeneic tumor models
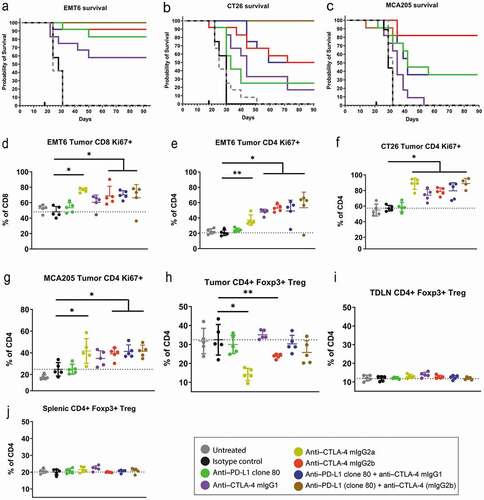
Figure 3. Anti-tumor efficacy and pharmacodynamic profiling of mAbs. Shown are in vivo efficacy and pharmacodynamic effects of anti-mouse PD-L1 and CTLA-4 surrogates in mouse syngeneic tumor models that are sensitive to checkpoint inhibition. (a–c) Kaplan-Meier survival curves of mice engrafted with EMT6, CT26, or MCA205 tumors and treated with anti–PD-L1 or anti–CTLA-4 mAbs. (d–g) Pharmacodynamic activity of monotherapy or combination anti-PD–L1 plus anti–CTLA-4 therapy in EMT6, CT26, and MCA205 models as measured by CD8 or conventional CD4 T-cell proliferation (Ki67 positivity). (h–j) Proportion of FoxP3+ Tregs in tumors, tumor-draining lymph nodes, and spleens of mice engrafted with CT26 tumors