
Figures & data
Figure 1. Analysis of CD160 library diversity after phage display enrichment
[a] Chord diagram representation of the V and J gene frequency and their associations in phage display libraries. Pan 0 represents the unpanned library; pan1, pan2 and pan3 represent the library after the 1st, 2nd and 3rd round of panning, respectively. Correlation plots are shown between IGVH-IGVJ top panel and IGVK-IGVJ bottom panel. [b] Bayesian analysis of highest frequency IGHV genes at each round of panning. Plots are overlaid against analysis from alternative panning rounds to indicate difference in selection distribution. [c] CDR length distribution of all HCDR3 sequences derived from the IGHV5S13*01 germline chain. Amino acids length distribution at the HCDR3 position throughout the panning process. [d] Sequence logo plot of 12 AA length HCDR3 sequences derived from the IGHV5S13*01 germline chain.
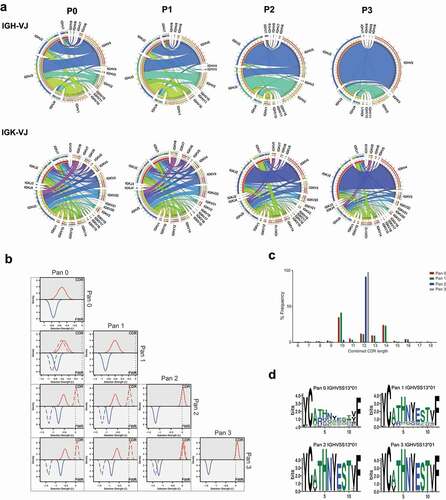
Figure 2. Heavy and light chain pairing in phage libraries
[a] Chord diagram representation of IGVH and IGVK frequency and their associations in phage display libraries. [b] CDR length distribution of all six CDRs from heavy and light chain of antibodies within the CD160 library derived from the IGHV5S13*01-IGVK1 pairs. [c] Sequence logo plot of all six CDRs from the heavy and light chain of antibodies within the preselected CD160 library derived from the IGHV5S13*01-IGVK1 pairs.
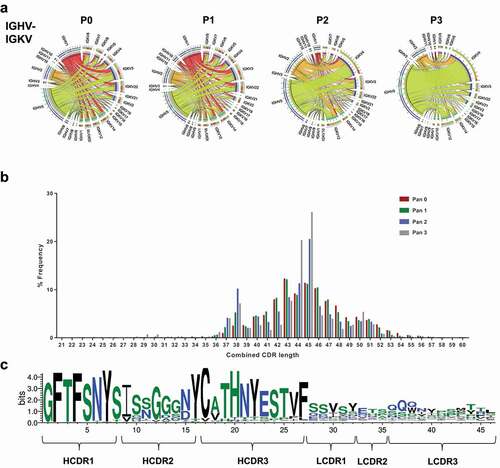
Figure 3. Overview of strategy to generate antibodies from deep-sequenced scFv libraries
Animals are immunized by genetic vaccination. Phage display libraries are derived from successfully seroconverted animals and subjected to 2–3 rounds of panning followed by sequencing using PacBio SMRTbell technology. Hairpin adapters are ligated to each fragment of DNA, providing a binding site on the chip and a uniform priming site for the DNA polymerase. The polymerase reaction resembles a rolling circle replication and creates multiple reads of each molecule, which are used to calculate a consensus sequence. Clones selected from analyzed sequences are generated using DNA printing technology and produced using high throughput expression prior to biophysical analysis.
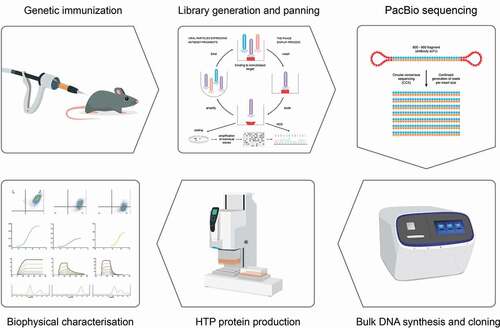
Figure 4. Identification and characterization of scFv clones
[a] Bottom panel, flow cytometry analysis of scFv antibodies based on HCDR3 sequence of the top 20 most abundant HCDR3 sequences, 15 were shown to bind by flow cytometry (blue bars), 5 of which were identified also by phage display (green border). Top panel, relative abundance of IGVK clonotypes for each HCDR3 sequence. The top 3 IGVK clones are highlighted in blue, red and green, additional VK clonotypes grouped in grey. Right panel, circular phylogenetic tree of the IGVK clonotypes identified for the most represented HCDR3. [b] Left panel, differential scanning fluorimetry analysis of antibodies obtained from NGS analysis of enriched CD160 library. Binders identified also via phage display are marked in red. A range of melting temperatures were obtained, spanning from 45°C to 78°C. Right panel, Biacore SPR affinity measurement of selected HCDR3 clonotypes for recombinant CD160. Measured on rates (ka 1/Ms) ranging from 1.37 × 10⁵ to 1.65 × 10⁶ and off rates (kd 1/s) ranging from 3.05 × 10⁻² to below 1 × 10⁻⁶. Binders additionally identified via phage display are marked in red. * = kd restricted to 1 × 10⁻⁶ (1/s). [c] Epitope binning experiments using CD160 binding scFvs. Representative competition sensorgrams are shown from two bins, along with heat map of relative binding competition of antibody pairs. A total of five distinct epitope bins were identified. Phage selected HCDR3 clonotypes marked in red circles on epitope bin representation.
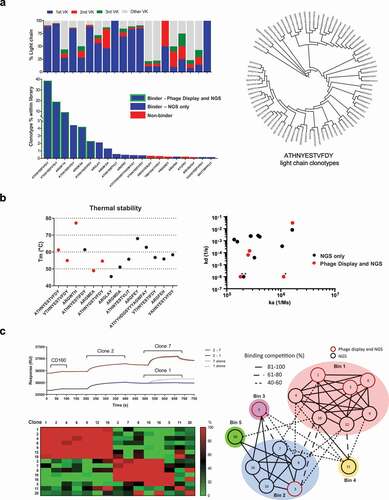
Table 1. Summary of the top 20 CD160 scFv identified
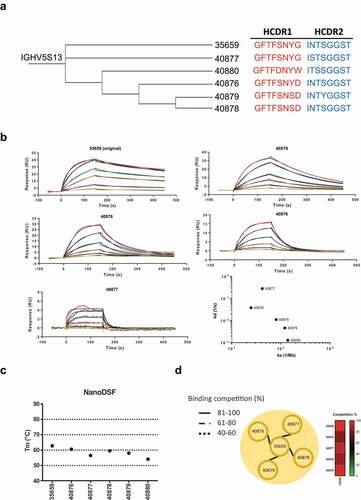
Figure 5. Identification of alternative binders in the NGS data set
[a] Phylogenetic analysis of CD160 library from pan 3 showing HCDR1 (red) and HCDR2 (blue) variants related to clone 35659 (clone 11 – ATIYYHDGSYYYAGWFAY) and diversion from germline sequence. [b] Biacore SPR binding data demonstrating the range of affinities for clone 35659 and relatives, targeting the same epitope on CD160. Right panel, on rates (ka 1/Ms) and off rates (kd 1/s) plot ranging from 2.47 × 10⁴ to 1.38 × 10⁵ and 1.29 × 10⁻³ to 2.82 × 10⁻¹, respectively. [c] Left panel, thermal stability of clone 35659 HCDR1-HCDR2 sequence relatives, with Tm ranging from 54.2°C to 62.8°C. Right panel, epitope binning experiment on 35659 related clones showing high competition and single epitope bin association.
Supplemental material