
Figures & data
Figure 1. Structural analysis of HC-LC interface
A) Schematic illustration of an IgG structural configuration and surface representation of the Fv region. In the Fab arm colored in blue, the Fv (VH/VL) interface, CH1/CL interface and CDR regions are each circled by dash lines. The surface of VH and VL domains of an IgG (PDB:1HZH) was created using PyMol with a color code for each CDR. The interface between VH and VL is highlighted with a dash line. B) Calculation of HC/LC interfacing residues using six structures performed by PDBePISA.Citation21 The number of interfacing residues in the corresponding regions are listed. C) Sequence alignment of 508 human antibodies with structures deposited in Protein Data Bank (PDB) highlighting the CDRs diversity.
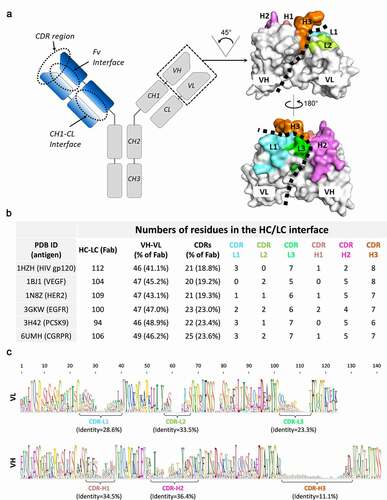
Figure 2. Schematic representation of the design of high-throughput Chain Selective Assessment methods (CSA)
A) Schematic representation of high-throughput CSA. Two panels of parental mAbs against Target-A (in blue) and Target-B (in green) are subjected to high-throughput screening with 2 possible outcomes, 4-chain hetero-IgGs and cLC hetero-IgGs. B) Schematic and timeline of the two high-throughput CSA methods. The entire process for both CSA methods takes less than 6 weeks. In the competition CSA (cCSA) experiment, each anti-Target-A mAb is combined with every anti-Target-B mAb. To ensure HC heterodimerization CPMs represented in red and blue dots were engineered into the CH3 domains. Thus, four HC/LC pairing scenarios are left to the native properties within the chains interface. All combinations of 2 HCs and 2 LCs are co-transfected into 293-6E cells, followed by ProA purification and LC-MS quantitation of each IgG species. A sample with high percentage of correct MW IgG species will indicate that the corresponding antibody combination have a high preference for cognate HC/LC pairing while minimizing cross-pairing. In the non-competition CSA (ncCSA) experiment, non-cognate HC/LC pairs are tested for expression in 293-6E cells, followed by ProA purification and determination of protein concentration (A280). High level of hybrid IgGs expression will suggest promiscuous LCs to be selected for cLC hetero-IgGs assembly together with the cognate and non-cognate HCs. To identify positive binders, purified hybrid IgGs are further analyzed by ForteBio Octet HTX.
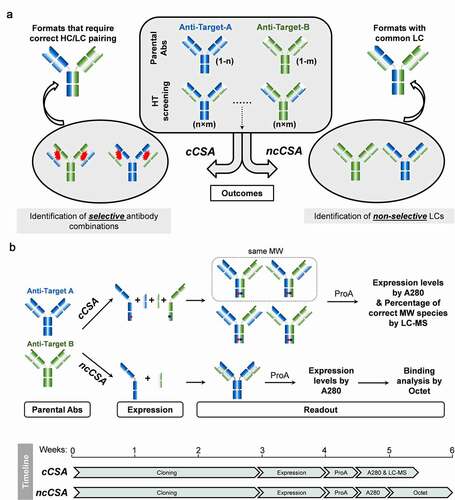
Figure 3. High-throughput screening for low cross-pairing antibody combinations in cCSA experiment
A) Analysis of protein expression level. Twelve parental mAbs (8 anti-Target-A and 4 anti-Target-B) and the 32 resulting hetero-IgG combinations were transiently expressed in 293–6E cells. The molecules in the conditioned media were purified with a high-throughput KingFisher Flex system, followed by measuring protein concentration (A280). Expression levels are represented by ProA yields calculated in milligrams (mg) per liter of cell culture. B) Representative LC-MS analysis for two ProA purified samples (A3× B4 and A4× B2) highlighted with schematics showing correct and mispaired IgG species. C) The percentage of IgG species with Hetero-HCs was calculated from LC-MS data and plotted. Percentage of IgG species with correct MW (1× HCA+1×LCA+1×HCB+1×LCB) reflects the correct HC/LC pairing. *, small MW difference between two LCs where LC-MS unable to distinguish IgG species.
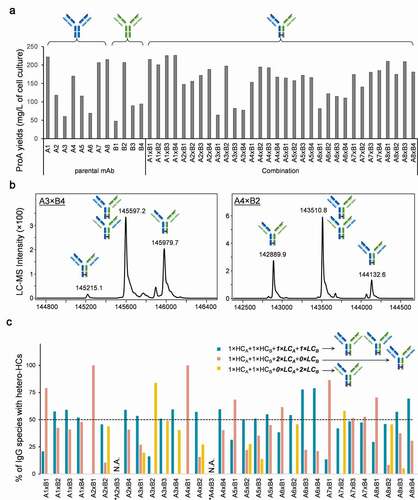
Figure 4. Predictability of HC/LC pairing in 4-chain hetero-IgGs
A) Final yields observed after CIEX purification with a purity target of >90%. The yields of hetero-IgGs and their corresponding parental mAbs were plotted side-by-side. B) Receiver operating characteristic curve (ROC) plot of the CIEX yields and % of correct IgG species. C) Correlational analysis of CIEX yields and HC/LC pairing. The dash line indicates 50% benchmark of correct IgG species determined by LC-MS. D) CIEX chromatographs of two representative molecules. E) Breakdown of the number of molecules in each step of cCSA experiment.
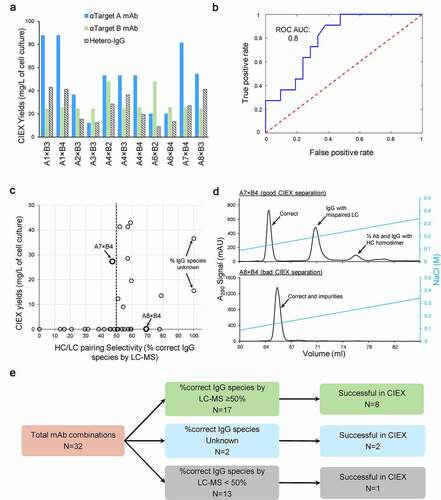
Figure 5. High-throughput screening for cLC hetero-IgGs by ncCSA
A) Relative expression of 144 non-cognate HC/LC pairs in two bispecific panels (A×B and C ×B). ProA yield of each non-cognate HC/LC pair was normalized to that of the corresponding cognate HC/LC pair (mAb) control. A non-cognate HC/LC pair with relative expression level >0.5 suggest that its LC is promiscuous to the paired non-cognate HC and it becomes selected to assemble cLC hetero-IgG together with cognate HC. B) Selected ProA purified non-cognate HC/LC pairs and mAb controls were analyzed by non-reducing SDS-PAGE gel and measured by A280 to determine yields. C) Schematics of two possible cLC hetero-IgGs. CPMs are shown as red and blue dots in the CH3 domains. D) and E) Expression levels of cLC hetero-IgGs for the two bispecific panels, A ×B and C ×B, respectively, represented by ProA yields calculated in mg per liter of cell culture. Dash lines highlight 60 mg/L. F) Heatmap plot of the relative binding affinity of cLC hetero-IgGs to their cognate and non-cognate antigens. The binding affinity (KD) of 106 cLC hetero-IgGs and 22 corresponding mAbs to soluble antigen-A, - B, or - C was measured by ForteBio Octet. Then, the relative binding affinity of cLC hetero-IgGs compared to that of the corresponding cognate and non-cognate HC mAbs were calculated and plotted. G) Inverted pyramid diagram showing number of molecules in each step of ncCSA experiment.
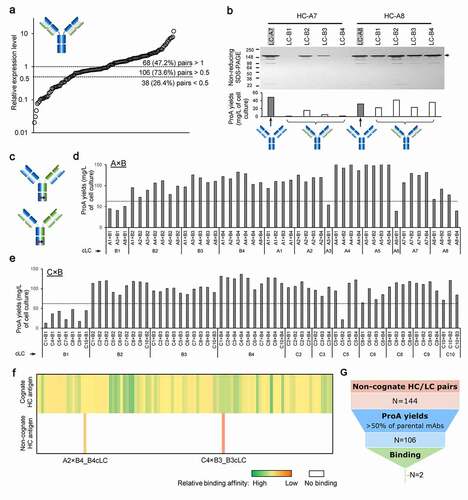
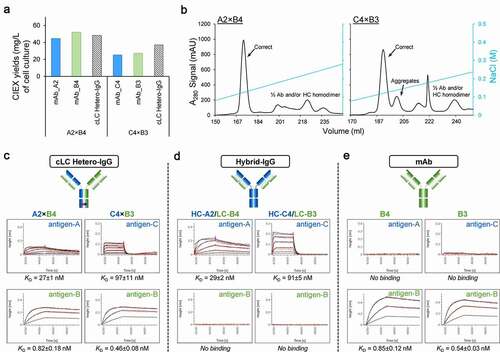
Figure 6. Expression, purification and binding properties of two selected cLC hetero-IgG molecules
A) Final CIEX yields of two cLC hetero-IgGs (A2× B4 and C4×B3) and their corresponding parental mAbs. B) CIEX chromatographs for A2× B4 and C4× B3. C–E) Binding kinetics of two cLC hetero-IgGs (A2×B4 and C4×B3) and respective controls (two hybrid IgGs (HC-A2/LC-B4 and HC-C4/LC-B3) and two parental mAbs (B4 and B3). Representative binding kinetics sensorgrams show processed data overlaid with the global fit to a 1:1 binding model. The weaker binding to antigen-C is rapid equilibrium with a lack of curvature leading to the larger variance in replicate measurements. The binding affinity (KD) was calculated as mean ± SE from three independent measurements.
Supplemental material