
Figures & data
Figure 1. Flexibility and other features of human IgG subclasses. Top: Representation of the Fab domain flexibility with respect to the hinge regions of the human IgG subclasses in which positions for Fab domains are represented by spheres in purple and teal. Figure adapted from Hansen et al.Citation6 with permission. Bottom: Measured values for various physical attributes of IgG3 compared to other human subclasses
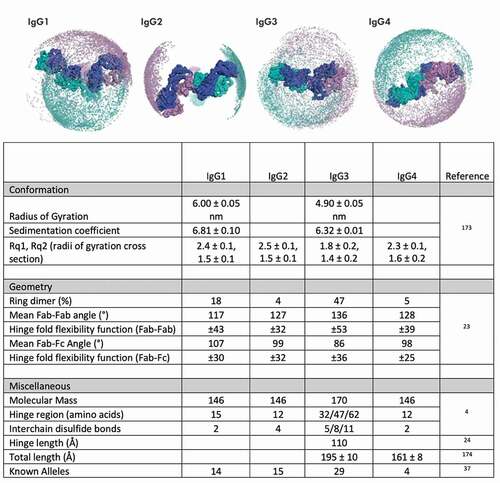
Table 1. Human IgG3 allotypes. Individual allelic positions are mapped against IGHG3*01 sequence by EU position number. The first listed accession number in the IMGT database is listed for each given allelic variant. Although several alleles contain synonymous polymorphisms, only non-synonymous SNPs are listed
Figure 2. Sites of amino acid polymorphisms in IgG3 CH2 and CH3 domains. Red amino acids indicate sites of amino acid sequence diversity among G3m allotypes. Brackets indicate recognition footprints of various human Fc receptors
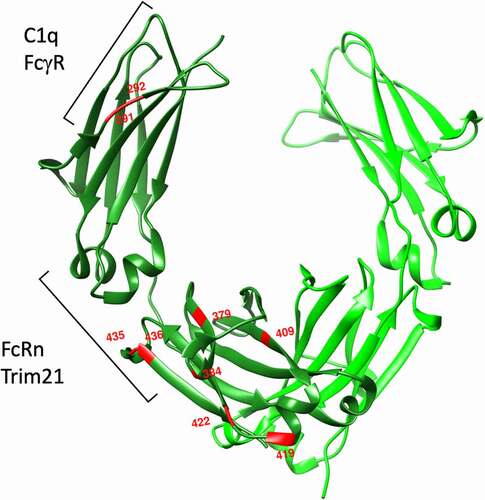
Figure 3. Human IgG responses over time and IgH locus arrangement in human, mouse, and rhesus. Top: Schematic of subclass composition over time for human IgG. IgG3 appears early and wanes over time. IgG1 additionally increases early and titer remains high. IgG2 and IgG4 appear later in infection. Affinity increases over time during infection due to somatic hypermutation. Bottom: IGHC locus arrangement across species. Subclass naming convention is based on serum prevalence rather than genetic similarity
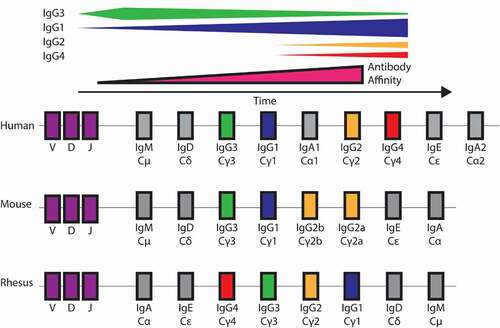
Table 2. IgG hinges of various species. Red lettering indicates disulfide bond positions
Table 3. FcγR binding affinities of human IgG Subclasses. Some interactions were not measurable (n.m)