
Figures & data
Figure 1. Platelet count in ABT-736 13-week monkey toxicity study. Each line represents the mean of the dose group (n = 10). Vertical line at Day 91 demarcates the beginning of the dose-free recovery period. On Day 84, samples were collected prior to dosing, immediately after dosing, and 24 hours after dosing
Figure 2. Histological evaluation of cynomolgus monkey tissues. 13 weeks IV administration (once weekly) with 60 mg/kg ABT-736 (a) lung; thrombosis and medial hyperplasia of large lung arteries (star); (b) brain; hemorrhage (double arrows) and degeneration of Purkinje cells and granule cell layer (arrows). Hematoxylin and eosin stain
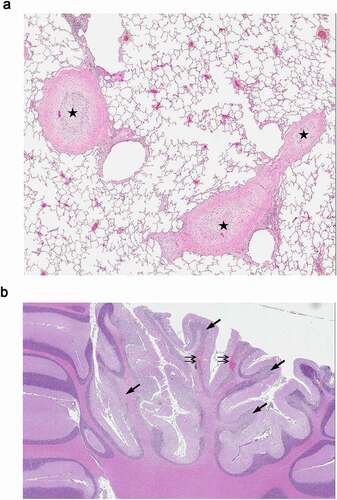
Table 1. Summary of doses, dose routes and findings in the 13-week repeat dose toxicity study and 4-week exploratory study in monkeys with ABT-736
Figure 3. ABT-736 in vitro cytokine release. Trastuzumab (human IgG1) is used as a negative control. LPS is used as a positive control. (a) Dose-dependent IL-8 release in whole cynomolgus blood. Representative data of one out of four monkeys shown. (b) Dose-dependent IL-8 release in whole human blood. Representative data of one out of two normal donors shown. (c) Lack of cytokine release by purified human PBMC isolated from normal donor
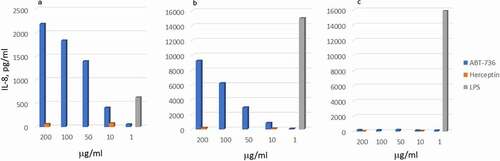
Figure 4. ABT-736 in vitro stimulates monkey platelets in a dose-dependent manner. Individual animal platelet activation curves. ABT-736 at a higher concentration of 1 mg/mL (Panel A) in both samples aggregates monkey platelets faster as illustrated by % aggregation (top curves of each plot) and causes degranulation as illustrated by ATP release (bottom curves of each plot) than at lower concentration (500 µg/mL, Panel B)
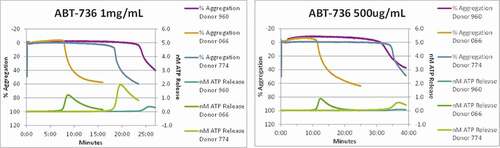
Figure 5. (a) Immunoprecipitation of cynomolgus monkey plasma analyzed via silver-stained SDS-PAGE resulted in a protein-band of approximately 8 kDa, which was specifically immunoprecipitated with ABT-736 and its mouse variant m7C6 but not with the pan-Aβ antibody 6E10 or isotype control antibodies. Note: additional bands at an apparent molecular weight of ~ 32 kDa and 55 kDa are unspecific bands, as they are present also in the IgG2a negative control and can be attributed to the elution of non-covalently bound antibodies from the immunoprecipitation beads (e.g., m7C6, mIgG2a) and are stained with the anti-mouse detection antibody. (b) SELDI-mass spectrometry analysis of the immunoprecipitates showed similar results and provided a more accurate mass of ~ 8144kDa of the cross-reactive protein hinting toward PF-4. (c) Western blot analysis provided further evidence for the ABT-736 PF-4 cross-reactivity in cynomolgus monkey and human plasma
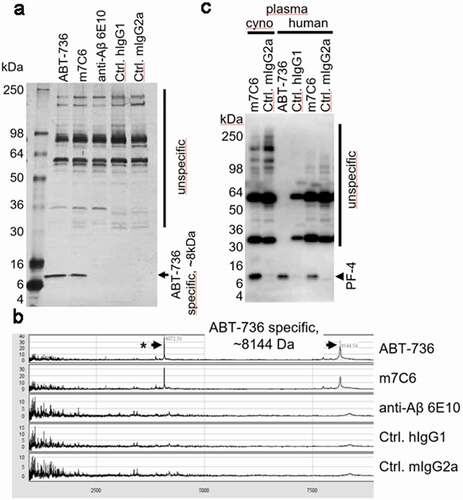
Table 2. Comparison of ABT-736 and h4D10
Figure 6. (a) A sandwich ELISA using pooled cynomolgus monkey plasma as a natural source of PF-4 was developed to enable screening for anti-Aβ oligomer antibodies that were devoid of PF-4 cross-reactivity. The m7C6 antibody used as a positive control shows very strong binding to PF-4 compared to an isotype control antibody and the successfully identified back-up antibody m4D10. (b) Similar results were obtained with the humanized versions of the antibodies (h7C6 and h4D10)
Figure 7. h4D10 does not stimulate monkey platelets. Individual animal platelet aggregation curves. (a)ABT-736 concentration (1 mg/mL) aggregates monkey platelets faster as illustrated by % aggregation (top curves of each plot) than the same concentration of h4D10. (b)h4D10 demonstrates low activity in 1 of 3 samples after a prolonged incubation, compared to high activity in 3 of 3 samples incubated with 1 mg/mL ABT-736
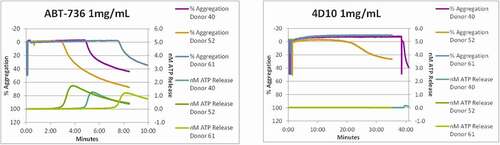
Figure 8. Pharmacokinetic profiles of ABT-736 (h7C6) and h4D10 in Sprague Dawley rat. Mean (± SD) serum concentrations of ABT-736 (black circle) or h4D10 (red triangle) following a single 4 mg/kg IV (open symbol) or SC (solid symbol) administration in Sprague Dawley rats (n = 6 M/6 F)
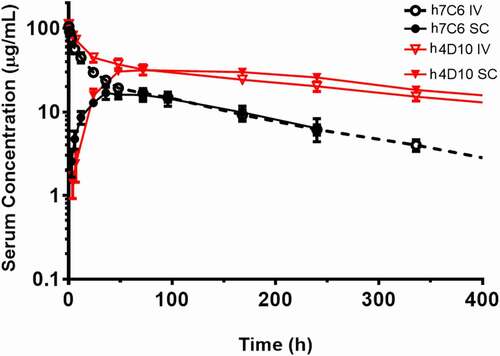
Figure 9. Assessment of off-target binding of human monoclonal antibodies in in vitro cell/particle binding assays. Human monoclonal antibodies binding to cells/particles from multiple species. FACS binding of human monoclonal antibodies to (a) HEK 293G cells, (b) CHO-K1 cells, and (c) COS-7 cells. (d) ELISA binding of human monoclonal antibodies to BV Particles. In all the graphs, the Y-axis represents relative signal to control where negative control is 1
Figure 10. (a) Ribbon representation of X-Ray structures of m10F11 (heavy chain: dark blue, light chain: light blue) and m4D10 (heavy chain: dark green, light chain: light green). The prolonged loop in m10F11 potentially essential for PF-4 binding is highlighted in yellow. (b) Ribbon representation of the heavy chain of m4D10 (green), m10F11 (blue) and m7C6 (purple), the prolonged loop is highlighted in yellow (m4D10) and orange (m7C6), polar amino acids shown as capped sticks. (c, d) Other antibody-PF-4 complexes from the protein database1 also contain this prolonged loop including polar amino acids interacting with PF-4 (orange); (c) KKOFab (blue/cyan, prolonged loop in yellow, PDB: 4R9Y), D: RTOFab (blue/cyan, prolonged loop in yellow, PDB: 4RAU). (e, f) Docked and composite model of in-house antibodies with PF-4 (orange); (e) The docked model between m7C6 (blue/can; prolonged refined loop in yellow) and PF-4 shows 14 hydrogen bonds in the interface including 4 with the amino acids on the prolonged loop (Ser102, Tyr104 and Tyr107), (f) The composite model of m4D10 (dark and light green) with PF-4 show less interactions (12 hydrogen bonds and only 1 interaction with the shortened loop), reduced binding affinity and a decreased interface caused by a hole established by the missing prolonged loop in m7C6
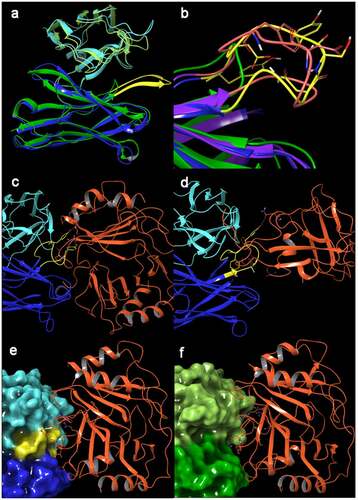
Table 3. Summary of 4-week exploratory study in monkeys with h4D10