
Figures & data
Table 1. In vitro binding affinities of antibodies against SARS-CoV-2 Spike
Figure 1. Fabs identified by phage display bind Spike RBD and Secto with high affinity outside of the ACE2 binding site
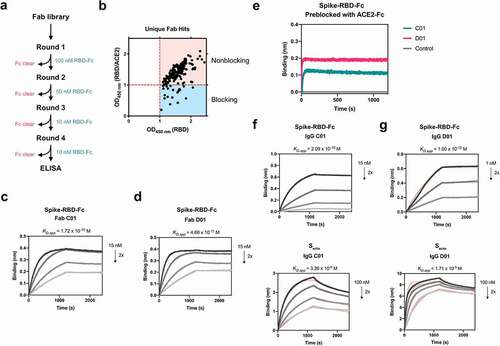
Figure 2. Bispecific VH/Fab IgGs bind with high affinity to trimeric Secto. (a) Cartoon schematic of the bispecific VH/Fab IgG antibody scaffold utilized in this study. (b-e) Multipoint BLI measurements (10 nM, 5 nM, and 2.5 nM) of the indicated bispecific antibody on Secto. (b) Bis1 (VH A01/FabC01) (c) Bis2 (VH B01/FabC01) (d) Bis3 (VH A01/FabD01) (e) Bis4 (VH B01/FabD01)
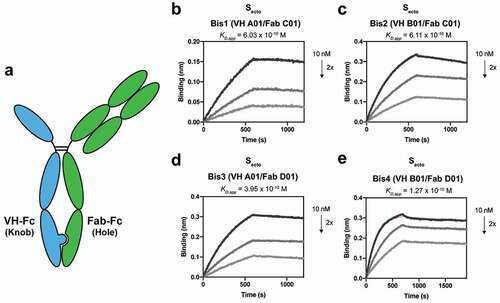
Table 2. SARS-CoV-2 Pseudovirus Neutralization IC50
Figure 3. Bispecific VH/Fab IgGs are more potent in neutralizing SARS-CoV-2 pseudovirus than the mono-specific counterparts
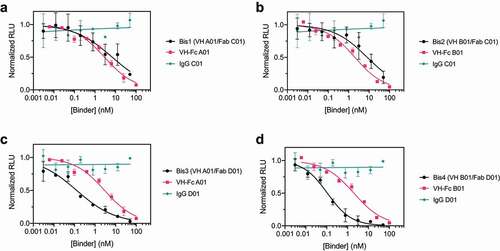
Table 3. Authentic SARS-CoV-2 Virus Neutralization IC50
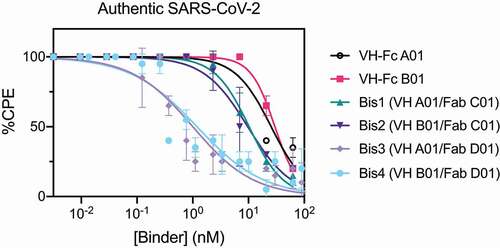
Figure 4. Bispecific VH/Fab IgGs neutralize authentic SARS-CoV-2 virus more potently than the mono-specific VH-Fcs
Supplemental Material
Download MS Word (6.4 MB)Data availability statement:
All data supporting the findings of this study are available from the corresponding author upon request.