Figures & data
Table 1. SAXS, MALS, and SPR experimental parameters
Figure 1. SEC-MALS-SAXS identifies mAbs that bind to NPNTD. (a) SEC-MALS-SAXS chromatograms for free and NPNTD bind mAb1, 2, and 4 (green, blue and red lines). Chromatogram for mAb5 + NPNTD (gray) sample is included for comparison to a no-binder. Solid lines represent the light scattering signal in arbitrary units, while symbols represent molecular mass (top) calculated from MALS and Rg values (bottom) for each collected SAXS frame versus elution time. (b) P(r) functions calculated for the experimental SAXS curves for all tested mAb + NPNTD samples (colored as indicated). The P(r) functions are normalized at the maxima. The experimental P(r) function for NPNTD alone is shown for the comparison and normalized relative to the MW estimated by SAXS.Citation37 Inset: Experimental Rg values determined by Guinier plot for the experimental SAXS curves of mAb+NPNTD mixtures (solid dots) and mAb1, 2, and 4 (circles) indicate binder and no-binder. Experimental SAXS curves for mAbs + NPNTD and free mAb1, 2, and 4 are shown in Supplemental Figure 1 and Figure 2B, respectively
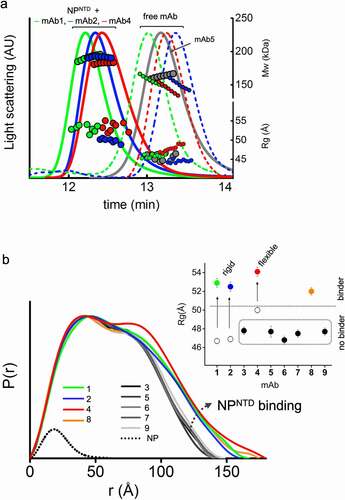
Figure 2. The flexibility of the NPNTD-binding mAbs. (a) P(r) functions for free mAb 1, 2, and 4 (top) and their complexes with the NPNTD normalized onto their maxima. The P(r) shoulder at r ~ 80 Å indicates the Fab-Fc separation described within the atomic model of IgG1 (inset). P(r) peak at 40 Å corresponds to the average size across Fc or Fab regions. (b) Experimental SAXS profiles of free mAbs 1, 2, and 4 (black) and theoretical SAXS profiles calculated from their respective two-state atomistic models (green, blue, and red) are shown in the panel. Residuals (Experiment/Model) for the fits of two-state models (green, blue, and red) are shown together with the best single model (gray) and indicate that the two-state model is required to match the experimental SAXS curves. (c) Two-state models for free mAb 1, 2, and 4 are shown together with the corresponding weights in % and Rg values. The Rg values and weights of mAb4 further confirm a larger separation between the Fc and Fab region. The atomistic models are shown as molecular envelopes at 10 Å resolution. The glycan-moiety in the Fc region is colored yellow. (d) The Rg distributions of the top 300 selected multistate models are shown for two-state (top panel) and three-state models (bottom panel) of free mAb 1, 2, and 4 (green, blue, and red)
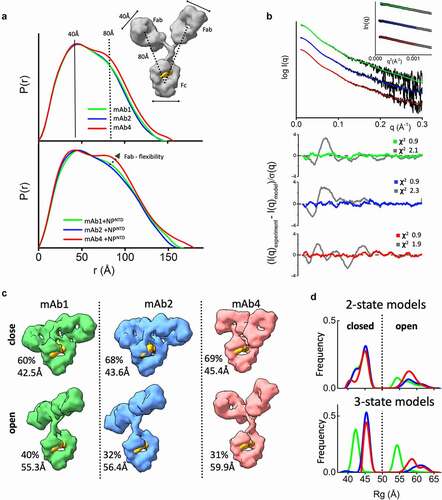
Figure 3. MAb linear or sandwich pairing depends on inherent flexibility. (a) SEC-MALS-SAXS chromatograms for the mAb1-2-NPNTD (green), mAb2-4-NPNTD (red) and mAb1-4-NPNTD (gray) samples. Solid lines represent the UV 280 nm signal in arbitrary units, while symbols represent molecular mass (top) calculated from MALS and Rg values (bottom) for each collected SAXS frame versus elution time. (b) P(r) functions calculated for the experimental SAXS curves for the main SEC peak of mAb1-2-NPNTD (green), mAb2-4-NPNTD (red), mAb1-4-NPNTD (gray), and early SEC shoulder of mAb1-2-NPNTD (green dots). The P(r) functions are normalized at the r = 40 Å. The P(r)-maxima peaks are indicated. Experimental SAXS and Guinier plots are shown in Supplemental Figure 1. (c) Average SAXS envelopes obtained for mAb2-4-NPNTD, mAb1-2-NPNTD complexes were calculated using a P2 symmetry operator. Average SAXS envelopes calculated using a P1 symmetry operator are shown in Supplemental Figure 3. A single representative envelope was manually superimposed with compact conformers of mAb1 (red), mAb2 (blue), and mAb4 (green) taken from the two-state model of free mAbs (see ). The structure of NPNTD (magenta; PDB ID: 6VYO) was manually docked at the proximity of the CRD3 -Fab region. Additionally, the SAXS envelope obtained for the larger multimer of mAb1-2-NPNTD determined in P1 symmetry is shown
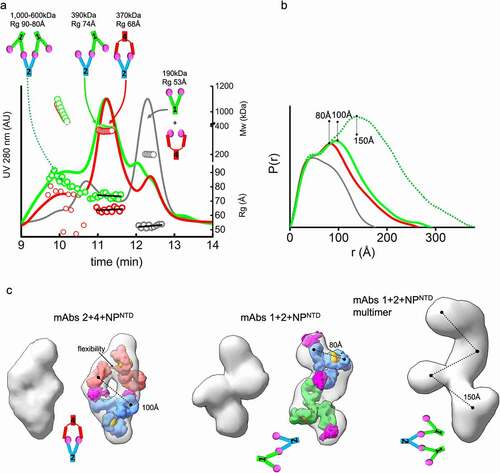
Figure 4. TEM 2D class averages highlight mAb-NPNTD pairing differences. Representative 2D class averages from NS-TEM data for mAb1-2-NPNTD (a), and mAb2-4-NPNTD (b). Scale bars are 10 nm
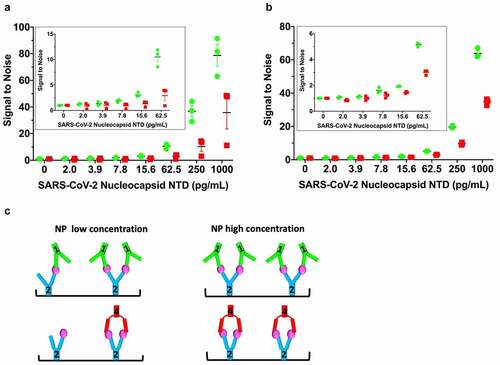
Figure 5. Linearly arranged mAbs show boosted signal in modified ELISA. (a) A modified ELISA where the detection HRP-conjugated mAbs (1-HRP in green, 4-HRP in red) are added directly on top of the samples during the NPNTD capture incubation period. Free (non-plate-bound) mAb2 is “spiked” into the detection HRP-conjugated mAb solutions before their addition on top of the samples. The corresponding standard control ELISA protocol run in parallel on the same plate is shown in Supplementary Figure 6A. (b) Repeat of the experiment conducted in (a), with a corresponding control ELISA protocol run in parallel on the same plate with a longer mAb-HRP-sample incubation period, shown in Supplementary Figure 6B. (c) Schematic of low versus high concentration of NPNTD in samples. In both experiments, the 1-HRP that forms the more rigid linear arrangement in the unconjugated form (mAb1-2-NPNTD) shows an ~2-fold increased ELISA signal, relative to 4-HRP, that forms a sandwich arrangement in the unconjugated form (mAb2-4-NPNTD). Each NPNTD concentration was run in triplicate, and the standard error of the mean for each is included