Figures & data
Figure 1. Overview of the NTERM conjugation method. (a) Schematic diagram of NTERM-conjugated ADC. (b) Chemical structure of the aldehyde-tagged MMAF (ald-MMAF). (c) Schematic representation of the NTERM conjugation reaction
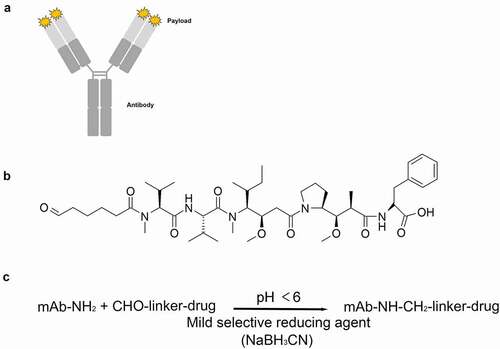
Figure 2. LC/MS analysis of NTERM conjugate. (a) DAR profile of T-N-F. T-N-F was analyzed using Waters Synapt G-2 system after deglycosylation reaction. Species with DAR 0–DAR 7 were observed and marked at D0–D7. The apparent DAR is 3.2 that is calculated as the weighted-average of DAR. (b) Conjugation sites were identified by peptide mapping. Trypsin-treated trastuzumab (top) and T-N-F (down) fragments mixture were resolved using an UPLC system with ACQUITY UPLC PST (BEH) C18 column
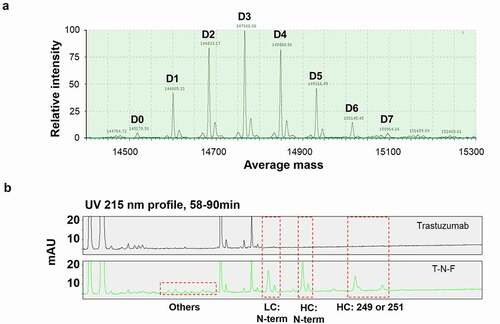
Table 1. Conjugation sites identified by peptide mapping
Table 2. Binding affinity and kinetics parameter of trastuzumab and trastuzumab-MMAF conjugates against HER2
Table 3. In vitro stability of ADCs in serum samples
Table 4. Pharmacokinetic parameters of trastuzumab and MMAF-conjugated ADCs
Figure 3. Pharmacokinetic profile of ADCs, synthesized with different conjugation techniques, in rats at a single dose of 2.5 mg/kg. (a) Overview of the total antibody concentration of ADCs. (b) Overview of the conjugated antibody concentration. Blue line represents T-N-F, whereas T-C-F, T-K-F, and trastuzumab are represented by red, green and magenta lines, respectively. (c) Overview of the total and conjugated antibody concentration profiles of T-N-F (left), T-C-F (middle), and T-K-F (right). Blue lines denote total mAb and red lines represent ADC. N = 5 and the error bars represent standard error
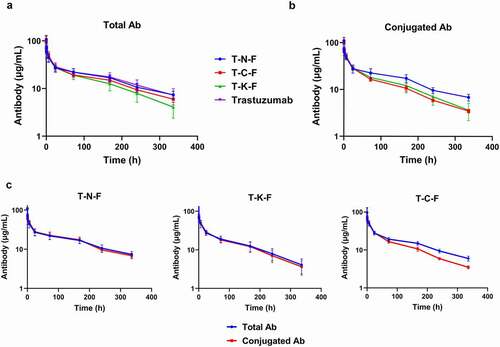
Figure 4. (a) Weight change of rats after administering a single dose of test samples. The numbers of survived animals are indicated on the right. (b) Dose-related hepatotoxicity induced by ADCs. AST and ALT activity in rat serum were assessed at day 5 after ADC administration. Each point denotes the average value obtained from five animals. Box plots denote mean value and 25–75% quartile
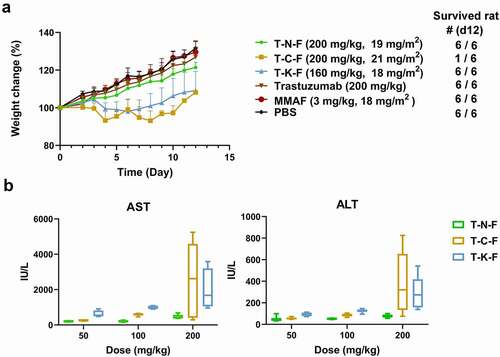
Table 5. Hematological analysis of rat blood on day 5 and day 12 after administration of test samples
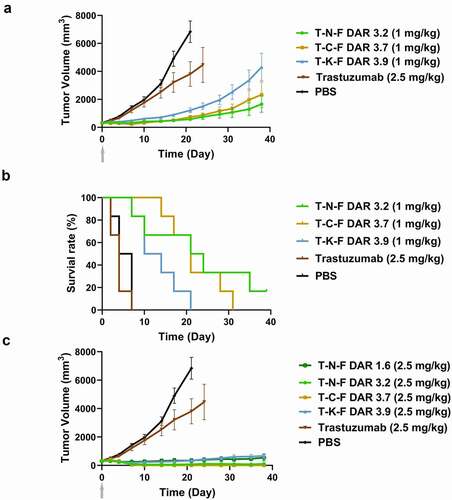
Figure 5. In vivo efficacy of ADCs in nude rat xenograft model. (a) Tumor growth curves of 1 mg/kg ADC-treated groups and PBS- or trastuzumab-treated groups. Tumor volume was calculated as 0.5 × (longest axis) × (shortest axis)2. N = 6, and the error bar represents the standard error. (b) Survival plots of 1 mg/kg ADC-treated groups and the control groups. Animals were removed from the study when their tumor size became 200%. (c) Tumor growth curve of 2.5 mg/kg ADC-treated groups. A single dose was intravenously injected on day 0