Figures & data
Figure 1. Adalimumab variants used in this study. (a) Abbreviations of adalimumab variants and their amino acid-substitution sites. (b) Positions of the amino acid substitutions shown in the 3D structure model of IgG (protein data bank ID: 1HZH). The positions are shown in color. (c) Amino-acid sequences of adalimumab variants. The substituted amino acids are shown in sequences of the variants, and the regions containing the amino acid substitutions are shown in color. The colors used correspond with those in (b)
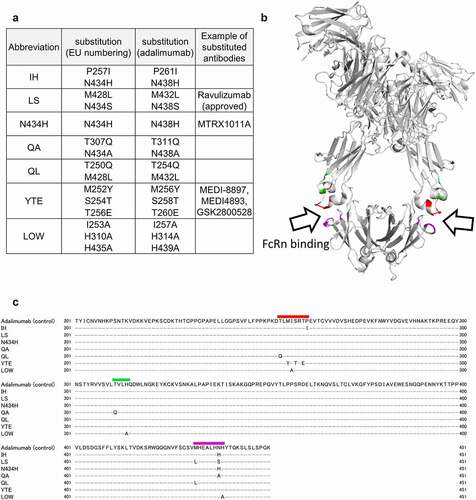
Figure 2. SPR analyses of the binding between Fc receptors and adalimumab variants. (a) Representative sensorgrams of FcRn binding. Immobilized level of FcRn, approximately 50 RU; Analytes, 670 nM. (b) KD values of FcRn binding calculated by steady state analysis. The analyte concentrations used for the calculation were 10.5, 20.9, 41.9, 83.8, 168, 335 and 670 nM for the IH, LS, N434H, QA, QL and YTE variants, and 41.9, 83.8, 168, 335, 670 and 1340 nM for native adalimumab. N.C., not calculated. (c) Representative sensorgrams of CD16a (FcγRIIIa) binding. Capture level of CD16a: approximately 120 RU; Analytes: 335 nM. (d) KD values of FcγRIIIa binding calculated by a two-state model. The analytes concentrations used for the analyses were 20.9, 41.9, 83.8, 168 and 335 nM. The analyzed fitted curve is shown in Supplemental Figure 3. (e) Representative sensorgrams of CD64 (FcγRI) binding. Capture level of CD64: approximately 60 RU; Analytes: 41.9 nM. (f) KD values of FcγRI binding calculated by a 1:1 binding model. The analytes concentrations used for the analyses were 2.62, 5.23, 10.5, 20.9 and 41.9 nM. The analyzed fitted curve is shown in Supplemental Figure 4. (g–i) Representative sensorgrams of CD16b (FcγRIIIb), CD32a (FcγRIIa) and CD32b (FcγRIIb) binding. Capture levels of CD16b, CD32a and CD32b: approximately 120 RU, 190 RU and 240 RU, respectively. Analytes: 670 nM. Colors of the sensorgrams in (c), (e), (g), (h) and (i) are the same as those in (a)
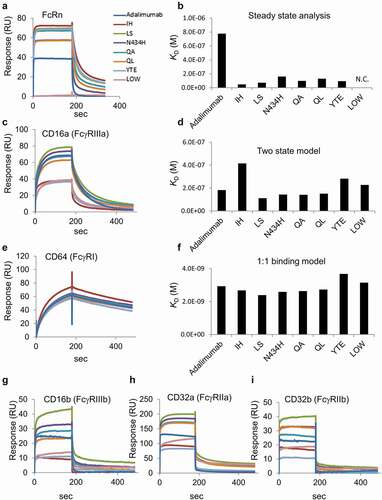
Figure 3. Sequence coverage map obtained by HDX-MS of intact adalimumab. The detected peptides were used to compare the deuterium uptake between samples
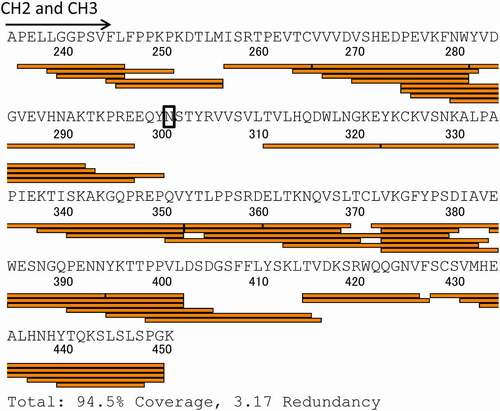
Figure 4. HDX-MS analyses. (a–e) Sequences and uptake plots of the peptides with variable deuterium levels. All samples were analyzed three times, and the data are shown as mean±SD. The residues are shown by the number of the adalimumab sequence
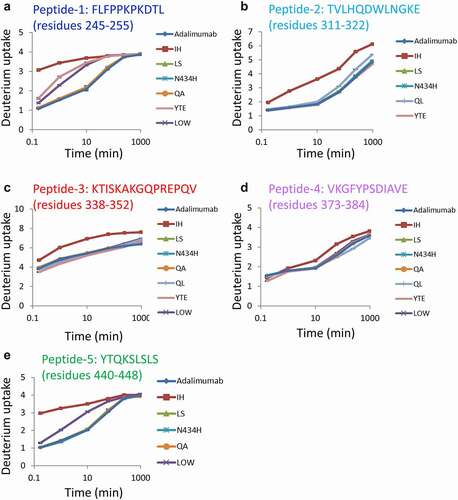
Figure 5. Regions with variable deuterium levels in the sequences of adalimumab variants. The colored boxes show the regions with variable deuterium levels. The orange lines in the colored boxes show the peptides with deuterium uptake different from that of adalimumab, and the black lines in the boxes show the peptides with deuterium uptake levels similar to those of adalimumab
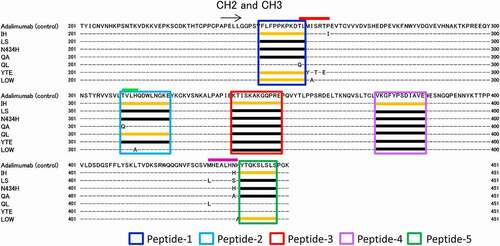
Figure 6. The regions with variable deuterium levels in the 3D structure of IgG Fc. (a) All regions with variable deuterium levels. Peptides 1–5 correspond to those in Figure 4 and 5. (b–h) The amino acid substitution sites and the peptides with variable deuterium levels of each variant
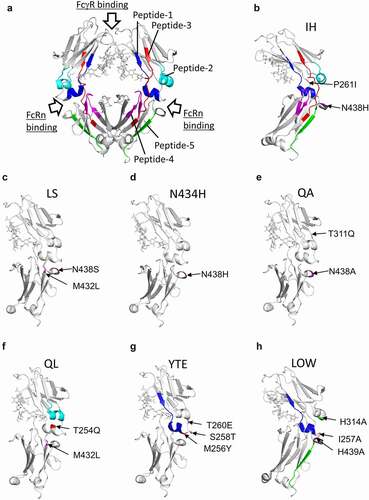
Figure 7. SPR analyses of the binding of adalimumab and etanercept to Fc receptors. (a) Representative sensorgrams of FcRn binding. (b) KD values of FcRn binding calculated by steady state analysis. (c) Representative sensorgrams of CD16a (FcγRIIIa) binding. Capture level of CD16a: approximately 250 RU. (d) KD values of FcγRIIIa binding calculated by a two-state model. (e) Representative sensorgrams of CD64 (FcγRI) binding. Capture level of CD64: approximately 80 RU. (f) KD values of FcγRI binding calculated by a 1:1 binding model. (g–i) Representative sensorgrams of CD16b (FcγRIIIb), CD32a (FcγRIIa) and CD32b (FcγRIIb) binding. Capture levels of CD16b, CD32a and CD32b: approximately 400 RU, 600 RU and 480 RU, respectively
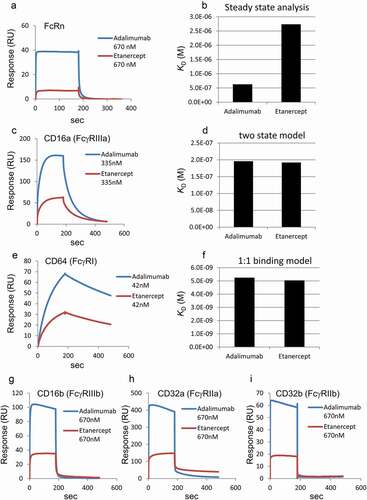
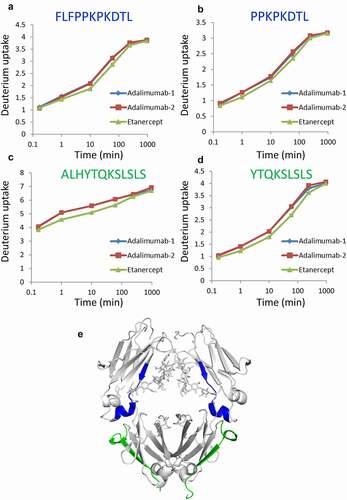
Figure 8. Regions with different deuterium levels between adalimumab and etanercept. (a–d) Uptake plots of deuterium. Peptides shown in (a) and (b), and those in (c) and (d) are overlapped. All samples were analyzed three times, and the data are shown as mean±SD. Two sets of the analysis of adalimumab are shown in (a–d) as Adalimumab-1 and Adalimumab-2. (e) The regions are shown in the 3D structure model of IgG Fc