Figures & data
Figure 1. Development of high-diversity VHH library and screening campaign for SARS-CoV-2 neutralizing VHHs. A) Library design using deposited sequences of functional VHHs from various sources. Data was mined to determine optimal CDR length and amino acid prevalence at each amino acid position within each respective CDR. B) Schematic for the biopanning approach used to identify neutralizing VHHs directed to the SARS-CoV-2 RBD. C) Polyclonal ELISA against multiple antigens show enrichment of a positive SARS-CoV-2 binding population of displayed VHH with each sequential round of panning. Data is from experimental conditions performed in triplicate; the error is the standard deviation from the mean. D) Neutralization of VSV-SARS-CoV-2 GFP viral infection with polyclonal VHH displaying phage from each round of panning. Data is from experimental conditions performed in triplicate; the error is the standard deviation from the mean (***, P < .001; **, P < .01; *, P < .05). The data represent one of three experiments with similar results
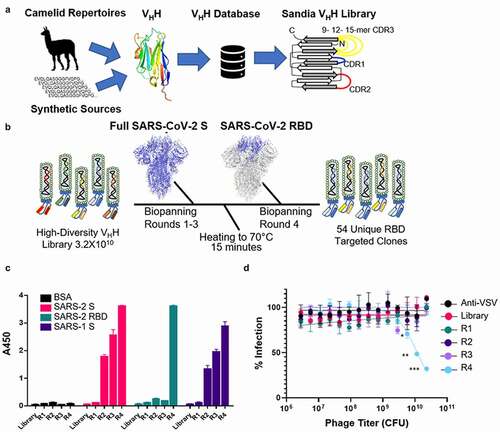
Figure 2. Evaluation of VHH-huFc candidates. A) Triage flowchart for selection of top candidates, from clonal phage ELISA to selection of 16 candidates for reconfirmation. B) Reconfirmation ELISA of top three candidates binding to SARS-CoV-2 S and C) SARS-CoV-2 RBD. D) Top candidate VHH-huFcs compete with ACE2-huFc for binding to SARS-CoV-2 S by competition ELISA and E) neutralize VSV-SARS-CoV-2 GFP infection of Vero cells. The data for a–e are from experimental conditions performed in triplicate, the error is the standard deviation from the mean. F) All three VHH-huFcs also neutralize wt SARS-CoV-2 in a plaque reduction neutralization assay. The data from this is the mean of the plaque assay performed in duplicate, the error is the standard deviation from the mean. BLI sensorgrams show binding to SARS-CoV-2 RBD by SP1B4 (g), SP1D9 (h), and SP3H4 (i). At least five concentrations were used for global fit analysis. J) Table summarizing kinetic properties, neutralizing efficacy, and thermal stability properties for SP1B4, SP1D9, and SP3H4. Melting temperatures from DSF were determined from two independent experiments each performed in triplicate
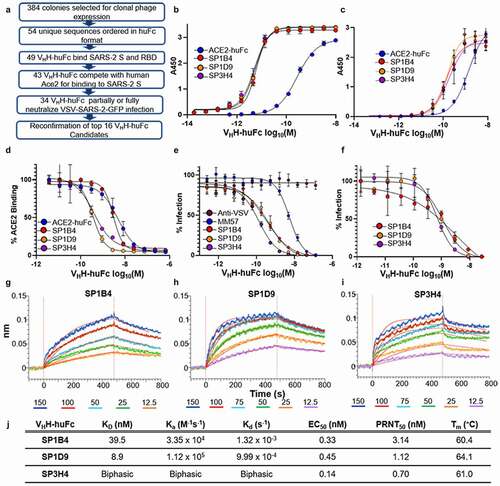
Figure 3. Genereation and Characterization of VHH-huFc Neutralization Escape Mutants. A) Subdomains of the SARS-CoV-2 S gene are color coded with correspoding structural context (PDB: 7CAK). Loci of mutations on S gene from NGS evaluation of virus supernatant from virus infected cells passaged in the presence of VHH-huFc antibodies. In this structure the RBD is in the “up” position. B) The RBD is designated with the dominant mutations characterized in this study (magenta). C) VSV-SARS-CoV-2-GFP neutralization escape occurs in a single passage. VSV-SARS-CoV-2-GFP neutralization is recorded 12 hpi. The black arrow designated the well from which the virus-containing supernatant was taken and diluted for the second passage. Data for this is from a single replicate. D) NGS and kinetic summary of each of the neutralization escape mutant profiles for SP1B4, SP1D9, and SP3H4. Dissociation constants for each individual RBD mutation with ACE2-huFc and VHH-huFc antibodies. N.B. = no binding observed at 150 nM SARS-CoV-2 RBD by BLI (Supplementary Figure 7–9). Sensorgrams were designated biphasic if they did not agree with a global 1:1 fit analysis. The prevalence of each escape mutation is presented as a percentage at that amino acid postion and is conditionally colored with increasing intesity of red
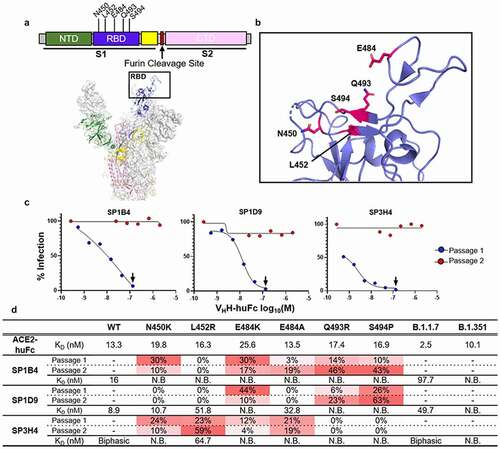
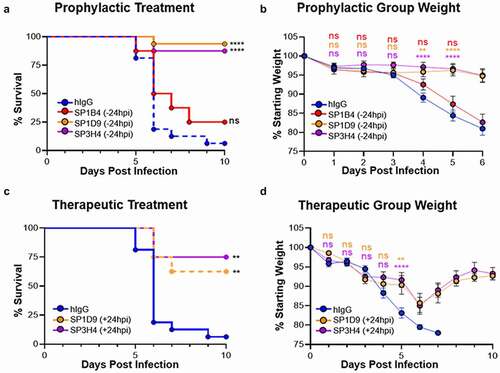
Figure 4. Top VHH-huFc candidates provide protection from lethal SARS-CoV-2 infection in vivo. Kaplan–Meier curve illustrating percentage survival of K18-hACE2 mice infected intranasally with 2.5 × 10⁴ PFU SARS-CoV-2 and dosed with 10 mg/kg VHH-huFc via intraperitoneal injection prophylactically (a) at 24 hours prior to infection or therapeutically (c) at 24 hpi. A log rank test was performed with Bonferroni multiple comparison correction applied. B) Percentage weight loss for mice in (A). D) Percentage weight loss for mice in (C). For (b) and (d), statistical analyses were performed at time points when all mice were alive to avoid survivor bias. Data displayed are the mean ± standard error of the mean. A & B) Isotype control n = 16, SP1B4 (−24 hpi) n = 8, SP1D9 (−24 hpi) n = 16, SP3H4 (−24 hpi) n = 16. C & D) Isotype control n = 8, SP1D9 (+24 hpi) n = 8, SP3H4 (+24 hpi) n = 8. Data represent two experiments (**** p < .0001; ** p < .01; ns = not significant)