
Figures & data
Table 1. Liabilities removed from CDR sequences
Figure 1. Schematic representation of library design and assembly. LCDR1-3 and HCDR1-2 are from sequences replicated from the naïve repertoire with the liabilities removed. They also undergo a filtering step using yeast display. HCDR3 is recovered from 10 healthy donors. The pieces are assembled to form the VH and VL and subsequently assembled as a scFv. The CDRs are all embedded in a scaffold derived from a developable therapeutic antibody
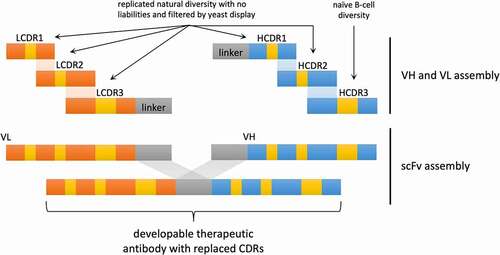
Figure 2. (a and b) Proportion of chains showing a liability in at least one of the CDRs in the human naïve repertoire (CDR1-2 for heavy chain and CDR1-3 for light chain), as assessed from a phage display library created from 40 healthy human donors. (c, d, and e) Segmentation of liabilities by V family and CDR
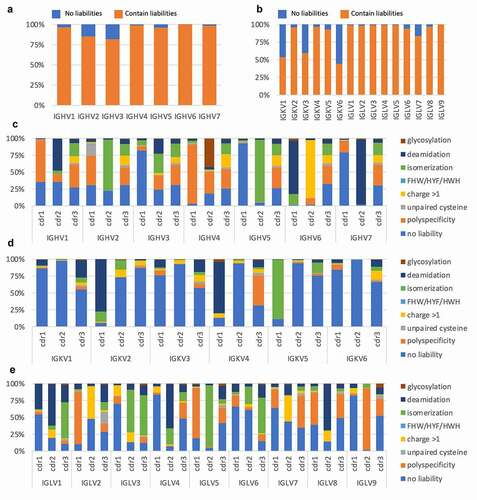
Figure 3. Analysis of the clinical antibody heavy (a) and light (b) V germline genes in comparison with the human naïve repertoire and the frequency of developable clinical antibodies (defined as having no more than one red flag). Chosen V domains are highlighted in red. (c) V germline genes of the clinical antibodies selected to be used as scaffolds in the new phage display library
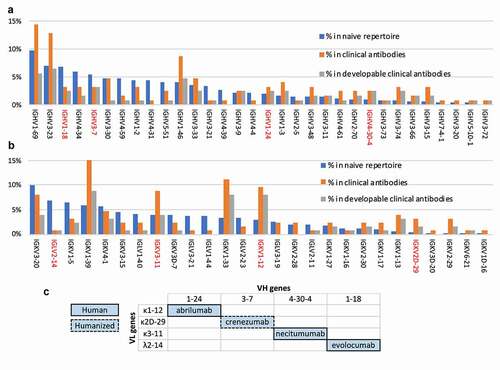
Table 2. Number of CDR sequences without liabilities synthetized as oligonucleotides. Theoretical diversity given is the product of the diversity of LCDR1-3 and HCDR1-2
Figure 4. Schematic representation of how each single-CDR library was built and sorted. (a) Design of the six yeast display vectors created for each of four scaffolds: one vector has the original clinical antibody reformatted as a single chain and the other five have one CDR replaced by Type II restriction enzyme sites for scarless insertion of CDR libraries and filtering, represented by a white gap. (b) Workflow for creation and filtering of each single-CDR library: liability-free, replicated natural CDRs are inserted into the open yeast display vector by homologous recombination and filtered for high expression using FACS or MACS. (c) Flow cytometry analysis of the four chosen therapeutic antibodies displayed as scFv on the yeast surface. (d) Flow cytometry analysis of the five single-CDR libraries corresponding to abrilumab (Lib1), comparing the parent therapeutic scaffold with the non-enriched libraries and the FACS/MACS libraries enriched for higher levels of display
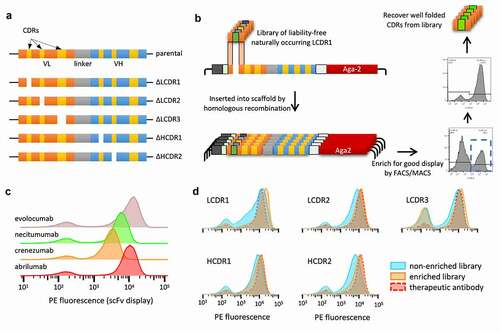
Figure 5. Comparison of CDR distribution and dominance between the natural naïve library, the non-enriched library and enriched single-CDR libraries. Data are shown for the libraries built using the abrilumab scaffold (Lib1, IGHV1-24, IGKV1-12)
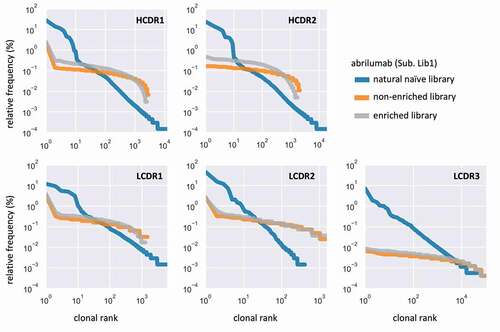
Figure 6. (a) Schematic representation of HCDR3 diversity rescue from 10 human donors. First, peripheral blood is submitted to leukapheresis; then recovered cells are purified by magnetic activated cell sorting (MACS) recognizing the CD19 marker for B-cells. The RNA is extracted, reverse transcribed with an IgM CH1 specific primer and the HCDR3 is amplified by PCR with primers specific to different germline families used in the library. (b) Saturation analysis of the HCDR3 deep sequencing results. (c) HCDR3 amino acid length distribution in library
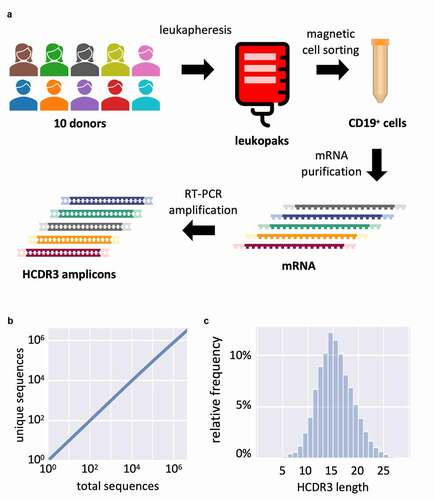
Figure 7. (a) Schematic representation of the selection process combining two rounds of phage display and yeast display. (b) Flow cytometry analysis of the final selected populations against each antigen at varying concentrations. Display is detected with anti-SV5 antibody labeled with PE and binding is detected with streptavidin labeled with alexa-633. (c) Levenshtein distance of merged CDRs between clones selected against GM-CSF. (d) Levenshtein distance of HCDR3 between clones selected against GM-CSF. (e) Surface plasmon resonance affinity plot for test clones from GM-CSF, IFN-2⍺, IL6 and TGFβ-R2. The diagonal lines (isoaffinity) represent the affinity (KD) of the antibodies, x-axis show dissociation constant (kd) and y-axis shows association constant (ka)
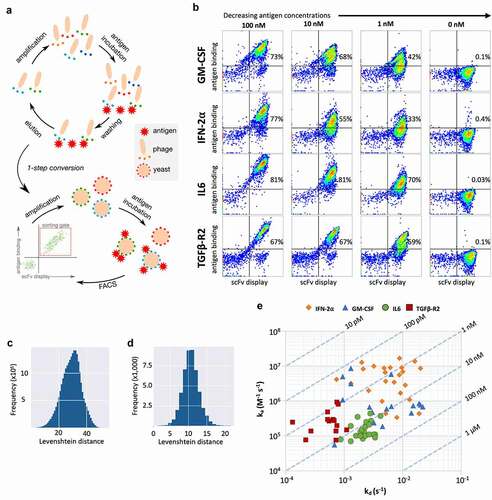
Figure 8. Developability profile of selected clones from the library. Measurement(s) of the selected clones (named A to D) are compared to the parental clinical scaffold (named P) and the therapeutic limit. The therapeutic limit is defined as two times the standard deviation of all measurements of the parental mAbs (Lib1-P, Lib2-P, Lib3-P, Lib4-P), represented by the horizontal line extending across each plot in the direction of better (blue) or worse (orange) developability. (a) AC-SINS, AC-SINS at 300 mM salt and polyspecificity results are derived from independent experiments (N = 3 for AC-SINS at 300 mM salt and AC-SINS; N = 2 for polyspecificity). The middle line, box limits and whiskers of the boxplot represent the mean, one standard deviation and two standard deviations of the repeat measurements, respectively. (b) HEKt, Tm, Freeze-Thaw and AS represent the final measured or calculated values from single experiments and depicted by thick horizontal line. Colors indicate whether the test mAb measurement(s) is better (dark blue box; dark blue line), worse (light orange box; light orange line) or within two standard deviations (light blue box; black line) of the therapeutic limit. The parental mAbs (red box; red line) are distinctly colored to provide reference for the test mAbs
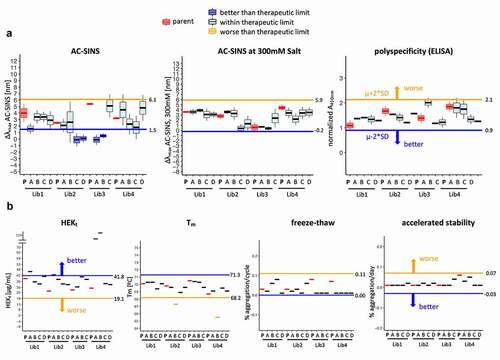
Table 3. Binding of clones to intended target in the IgG format measured by ELISA assay. Molecules were tested solely in the IgG format, not undergoing previous validation as scFvs