Figures & data
Figure 1. Asn162 glycosylation profiles of FcɣRIIIb, comparing recombinant (HEK) and human neutrophil-derived receptor (the latter extracted from Wojcik et al.Citation23). The data was normalized to the sum of all quantified compositions. For recombinant (HEK) FcɣRIIIb, these are listed in Table S1. Glycan structures of selected compositions are suggested based on MS/MS experiments and previous findings on HEK cell-derived or human-derived neutrophil FcɣRIII glycosylation.Citation23,Citation27 Asterisks (*) indicate that a glycopeptide was not detected
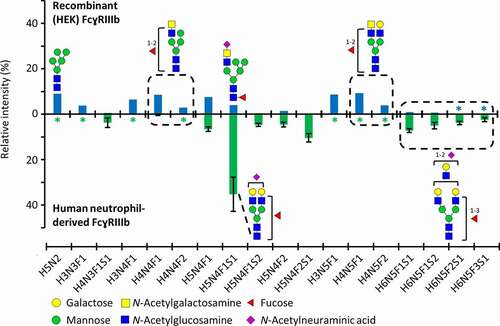
Figure 2. Optimized FcɣRIIIb AC-MS gradient. 30 mM ammonium acetate pH 6.8 (solvent A) and 50 mM acetic acid pH 3.0 (solvent B) were used as mobile phases. Base peak chromatograms (BPCs) of mAb1 (red) and mAb3 (blue) are displayed. The gradient (green) and the pH (gray) are displayed as well
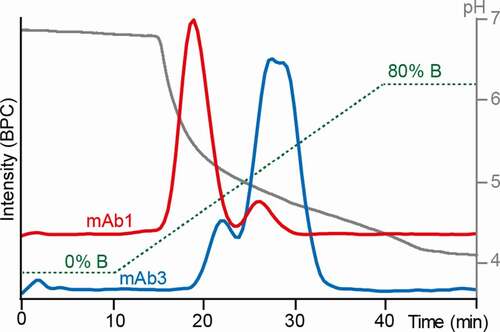
Figure 3. FcɣRIIIb AC-MS analysis of four IgG1 mAbs. A – D represent mAb1 to mAb4. Extracted ion chromatograms of glycoforms are displayed (Figure S9, S11 – 13, Table S3). Zoom in A visualizes low-abundant afucosylated glycoforms of mAb1. Some assigned minor glycoforms (< 5% relative to the main peak) of mAb2 – mAb4 are not displayed for visibility reasons
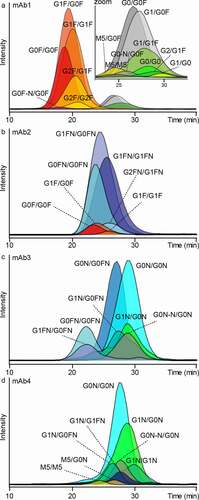
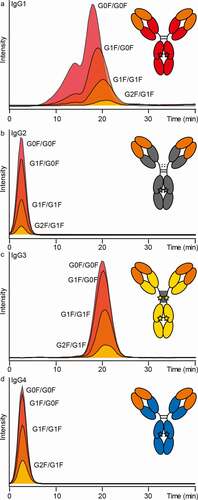
Figure 4. Anti-TNP IgG subclass comparison by FcɣRIIIb AC-MS. Extracted ion chromatograms of the major glycoforms are displayed for IgG1-4 (in panels A-D, respectively)