Figures & data
Figure 1. Schematic representation of the workflow used in this study to generate anti-CAIX mAbs. a) Cartoon of the rhCAIX ECD sequence (NP_001207.2) used: SP, signal peptide (gray); PG, proteoglycan-like domain (red); CA, catalytic domain (blue); His, penta-histidine tag (green) used for IMAC purification. b) Workflow of mAb production, characterization and selection process; for details see text
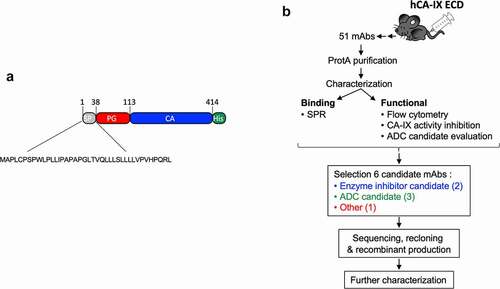
Table 1. Representative kinetic and apparent kinetic values for binding of recombinant anti-CAIX antibodies obtained by SPR analysis and by flowing rhCAIX monomer or dimer, respectively. Antibodies suitable for ADC, CAIX enzyme inhibitor and imaging/detection are listed in green, blue and red, respectively. The cG250 mAb was used as control (black)
Figure 2. Binding of selected recombinant anti-CAIX antibodies by Surface Plasmon Resonance. Six (6) hybridoma derived mAbs were selected through screening (see , Suppl. Fig. S2A-C), sequenced, recloned in the appropriate IgG framework and recombinantly expressed in CHO cells (for details see text). (a) Purified recombinant antibodies (c11H9, c12H8, c2C7, m4A2, m9B6, c2D7) were captured with the appropriate anti-Fc surface (anti-human Fc: c11H9, c12H8, c2C7, c2D7; anti-mouse Fc: m4A2, m9B6). cG250 was used as a benchmark. Serial dilutions (0.74–60 nM) of rhCAIX monomer (CAIX-M) and dimer (CAIX-D) were then injected, followed by a buffer injection. Sensorgrams were aligned, double-referenced, and fitted to the 1:1 binding model to calculate ka, kd, KD and RUmax when flowing CAIX-M and apparent ka, kd, KD and RUmax when flowing CAIX-D (see ). (b) Graphs depicting changes in the calculated ka, kd, KD and RUmax when flowing rhCAIX-M versus rhCAIX-D over the immobilized antibodies
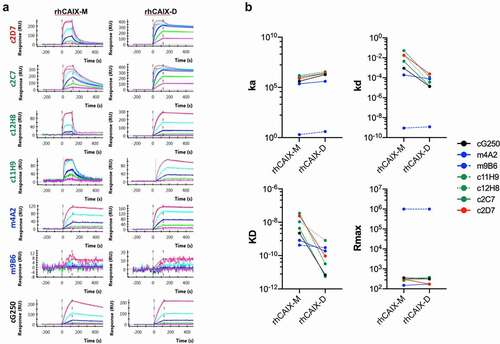
Table 2. Apparent equilibrium binding constants (EC50) and maximum specific binding (Bmax) values for the recombinant antibodies using SK-RC-52 cells expressing hCA-IX. cG250 and M75(both in black) were used as positive controls; negative controls (not listed) showed no binding (ADC candidates, green; enzyme inhibitors, blue and imaging/detection antibody, red)
Table 3. Biodistribution and tumor/non-target ratios for 111In-SCN-Bn-DTPA-mAbs (ADC candidate, green; detection/imaging antibody, red) 72 h and 168 h post injection (p.i.)
Figure 3. Binding of recombinant antibodies to hCAIX-expressing SK-RC-52 cells. Dose-dependent binding (0–100 nM) to SK-RC-52 cells of recombinantly expressed (a) chimeric antibodies (c11H9, c12H8, c2C7, c2D7) and (b) murine antibodies (m4A2, m9B6), together with the appropriate negative (hIgG1, mIgG2) and positive (cG250, M75) controls. Experiments were carried out in duplicate and repeated twice. Representative KD, Hill slope and Bmax (see ) values were calculated using Graphpad Prism v8
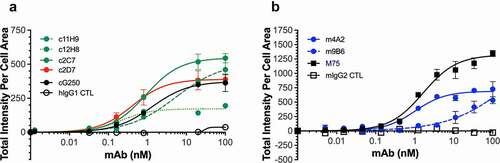
Figure 4. ADCC response of (a) chimeric (human Fc portion) antibodies (c2C7, c11H9, c12H8 and c2D7) and (b) murine antibodies (m4A2 and m9B6) using SK-RC-52 cells in conjunction with Promega’s Promega’s human FcγRIIIa or murine FcγRIV Jurkat-Luc bioreporter assay, respectively. Shown are the results of a representative experiment (± s.e.m.) carried out in triplicate and repeated twice; ADCC response was expressed as fold-induction of non-treated control cells, and data was analyzed using Graphpad Prism v8 software
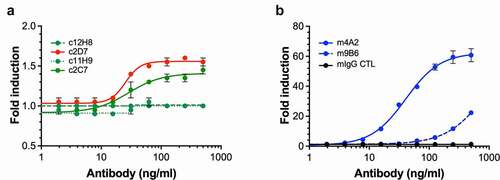
Figure 5. Evaluation of anti-hCAIX antibodies for inhibition of catalytic activity of CAIX. (a) In vitro assay assessing rhCAIX enzyme activity (rhCAIX dimer: 0.5 µM) as a function of 4-MUA (100 µM) substrate-released fluorescence over time in the presence of m4A2 (1 µM, blue open square) or m9B6 (1 µM, blue open circle). Murine IgG CTL mAb (1 µM, red open square) and SMI Acetazolamide (10 µM, black square) were used as negative and positive controls, respectively. (b) Kinetic analysis of the activity of rhCAIX dimer using the physiologic substrate of CAIX, CO2, in response to increasing concentrations of m4A2. Normal mouse IgG and non-function-blocking antibody c2D7 were used as negative controls. The spontaneous change in pH in absence of rhCAIX dimer is shown for reference. Data are presented as the mean ± s.e.m. of technical replicates (n = 3/group) and are representative of 2 independent experiments. (c) Quantification of the relative percent activity of rhCAIX dimer in response to increasing concentrations of m4A2, calculated from the AUC of data in panel B. Data are presented as the mean ± s.e.m. of technical replicates (n = 3/group) and are representative of 2 independent experiments (***P < .001; ANOVA)
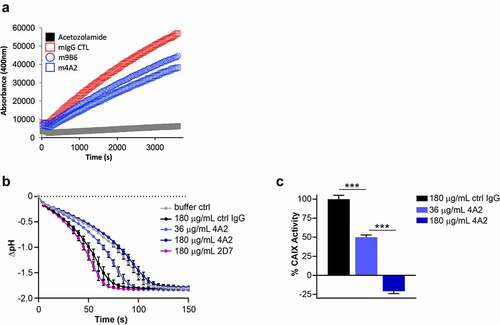
Figure 6. Assessment of recombinant anti-hCAIX antibodies as tools for immunohistochemistry and in vivo imaging applications. (a) Immunohistochemical staining for expression of CAIX in FFPE tissue sections from PK-8 human PDAC xenografts using recombinant antibodies c11H9, m9B6 and c2D7. Commercial anti-CAIX mAb, M75, was used as benchmark-based positive control. Scale bar, 100 μm; inset, 20 μm. Anti-CAIX antibody 11H9 (b) and a (c) control antibody (IgG) were conjugated to the chelator pSCN-Bn-DTPA and radiolabelled with 111In. Conjugates were administered to NODSCID IL2RKO mice bearing subcutaneous hCAIX-positive HT-29 colorectal cancer xenografts (100 mm3). Uptake, accumulation and retention of the radiolabelled 11H9 and IgG control were monitored 24–168 h post-injection by SPECT/CT imaging (B, C; see also ) (t, tumor; l, lung; s, stomach; h, heart)
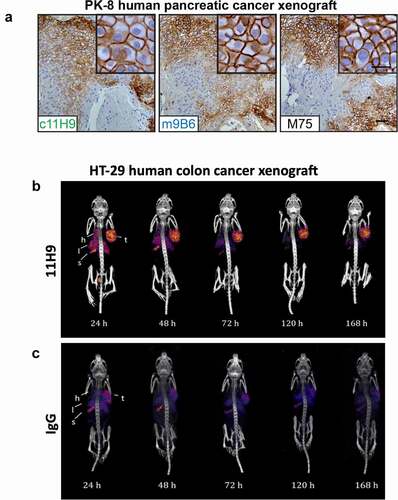
Figure 7. Evaluation of internalization and ADC potential of the CAIX antibodies in vitro (a) Representative processed images of SK-RC-52 cells incubated with serial dilutions of pHAb-labeled c2C7 (bottom) and hIgG-pHAb control (middle). Untreated cells (top) were used as background control (yellow, antibody; blue, nuclei). (b) Internalization dose-response (0–20 µg/mL) of pHAb-labeled mAbs by SK-RC-52 cells that were ‘coated’ with mAbs for 1h at 4°C, washed and then transferred to 37°C for 24 h. Cells were imaged using the ImageXpress Micro (IXM) Widefield High Content Screening System, and images were processed using MetaXpress imaging software and further analyzed using Graphpad Prism v8. (c) Calculation of the total amount of internalized pHAb-labeled mAb (10 μg/mL, at t = 24 h) by SK-RC-52 cells, corrected for nonspecific internalization and expressed as fold change from t = 0 h. For all graphs, ADC candidates (c11H9, c12H8, c2C7), enzyme inhibitors (m4A2, m9B6), the imaging/detection antibody (c2D7), and the control antibody are depicted in green, blue, red, and black respectively
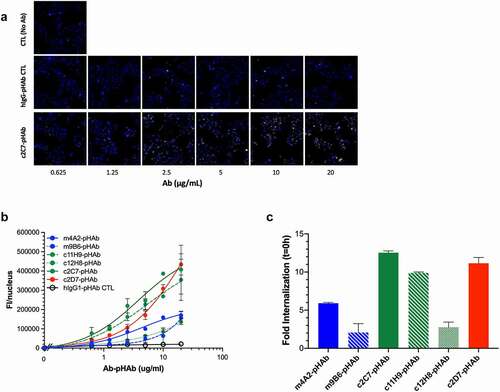
Figure 8. Evaluation of the ADC potential of the CAIX antibodies in vitro. (a) Analysis of expression of hCAIX by 67NR mouse breast cancer cells engineered to constitutively express hCAIX (CAIX-pos), compared to parental, hCAIX-negative (CAIX-neg) cells. Top panel, immunoblot for CAIX. Vinculin was used as a loading control. Bottom panel, immunofluorescence images. Scale bar, 10 μm. (b) Viability of cells described in panel A cultured with increasing concentrations of DM1-conjugated (blue graphs) and non-conjugated (black graphs) CAIX mAbs or a nonspecific IgG CTL antibody. Data show the mean ± s.e.m. of technical replicates (n = 3/group) and are representative of 2 independent experiments. Representative IC50 values were calculated using Graphpad Prism v8. (c) Analysis of expression of hCAIX by MIA PaCa-2 human PDAC cells engineered to constitutively express hCAIX (CAIX-pos), compared to hCAIX-negative (CAIX-neg) control cells. Top panel, immunoblot for CAIX. Vinculin was used as a loading control. Bottom panel, immunofluorescence images. Scale bar, 20 μm. (d) Viability of cells described in panel C cultured with increasing concentrations of c2C7-DM1 (left) or non-conjugated c2C7 mAb (right) (blue graphs, CAIX pos cells; black graphs, CAIX negative cells). Data show the mean ± s.e.m. of technical replicates (n = 3/group) and are representative of 2 independent experiments. Representative IC50 values were calculated using Graphpad Prism v8
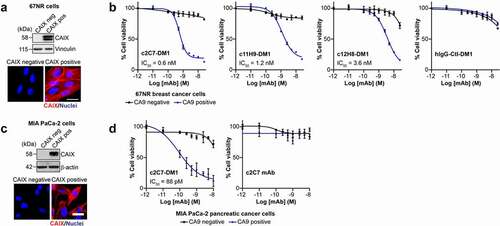
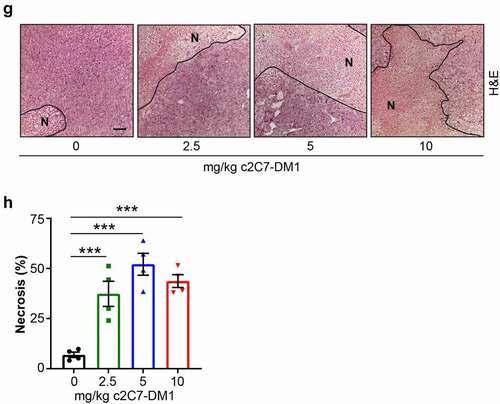
Figure 9. Administration of c2C7-DM1 ADC to mice bearing CAIX-positive MIA PaCa-2 tumors increases tumor cell death. (a) Representative images of tumor tissue sections from CAIX-positive MIA PaCa-2 PDAC xenografts stained for expression of CAIX. Scale bar, 100 μm; inset, 20 μm. (b-d) Mice bearing subcutaneous CAIX-positive MIA PaCa-2 PDAC xenografts were administered increasing doses of c2C7-DM1 (n = 8 mice/group). (b) Study timeline and tumor growth curve. ***P < .001; **P < .01; two-way ANOVA. (c) Tumor growth when control mice harboring tumors and administered vehicle reached the study endpoint. ***P < .001; *P < .05; two-way ANOVA. (d) Survival analysis of tumor-bearing mice administered 10 mg/kg c2C7-DM1, compared to mice given vehicle control. (e) Representative images of tumor tissue sections from CAIX-positive MIA PaCa-2 xenografts administered increasing doses of c2C7-DM1 and stained for cleaved caspase 3, a marker of apoptosis (black arrows). Scale bar, 50 μm; inset, 10 μm. (f) Quantification of cleaved caspase 3 (n = 5, each 5 fields). ***P < .001; *P < .05; two-way ANOVA. (g) Representative images of tumor tissue sections from CAIX-positive MIA PaCa-2 xenografts described in panel A stained with H&E to evaluate regions of necrosis. Boundaries between viable and necrotic tissue () are denoted with a black line. Scale bar, 100 μm. (h) Quantification of necrosis (n = 4, each 5 fields). ***P < .001; *P < .05; two-way ANOVA
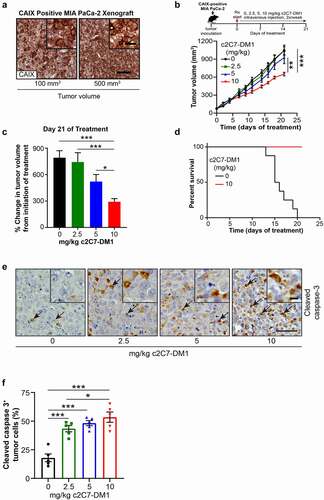
Figure 9. Continued